I love segments! I like how you can use them to specify your data. How you can use them to give more context to your data. And by specifying your data, you gain more insight and you get closer to understanding your audience. Being closer to understanding your audience, in turn, means being closer to a successful marketing campaign. I’ve written a post about why you should use segments in Google Analytics. In this post, I want to share five segments you can use to check three aspects of your blog’s audience: engagement, loyalty and traffic source. And you won’t even have to code! Let’s get started!
1. Engaged traffic
What’s the definition of engaged traffic? You can define blog engagement as any interaction people have with your blog posts. This could mean that they read the entire article. That they placed a comment, or shared it on social media. Perhaps they saved the blog post as PDF. Or they clicked on a relevant article that seemed interesting. If you look at these items and how you can measure them in Google Analytics, some of them need to be implemented manually. And that probably needs a bit of coding.
But, there are some standard metrics in Google Analytics that you can use to measure engaged traffic. For example, sessions that contain more than one pageview. And have a certain minimum session duration. It’s best to base the number of pageviews per session and session duration on your own data. You can look at the averages in your Google Analytics stats. You can find these averages in the Audience overview:
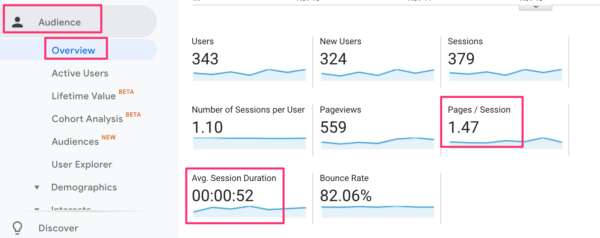
For this particular blog site, there’s an average session duration of 00:52 and visitors view 1.47 pages per session. This is how I would build a segment for this blog:
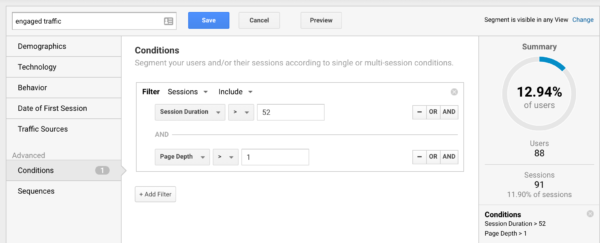
- segment 1: engaged traffic
It’s a segment based on sessions, and I used the AND command so that it takes both conditions to create this segment. In the segment builder, there’s a real-time check that shows if your segment works and how many users are in the segment. In this case, the number of users is pretty small. That makes it hard to draw valid conclusions; you’d rather see a larger sample size. There are a couple of things you can do in this case: take a larger date range, or adjust the segment and make it less strict. The latter option has its downsides, of course, because you might no longer be measuring engagement. But that’s up to you, really. If the number of users stays small, then the numbers you see are an indication and you’ll just have to test whether your assumptions are valid or not.
2. Loyal traffic
What’s the definition of loyal traffic? Loyal visitors are returning visitors that regularly come to your website and engage with your content. There are a couple of metrics in Google Analytics you can use to measure loyal traffic. In this case, we want to look at visitors that have started 3 sessions on our site. By setting a time frame, you can say that you want a segment of visitors that started 3 sessions in the last week, that didn’t bounce and had a session duration higher than 30 seconds. That segment would look a bit like this:
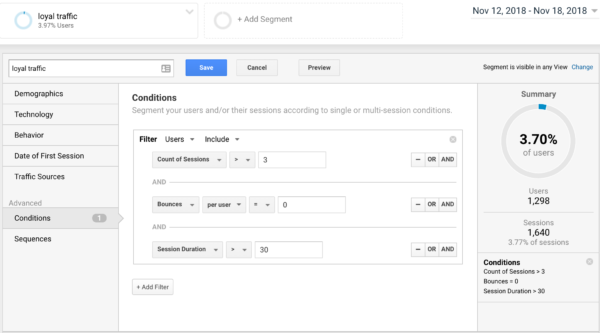
Now, the power of this segment lies in the comparison. You can create the opposite segment and call them non-loyal traffic.
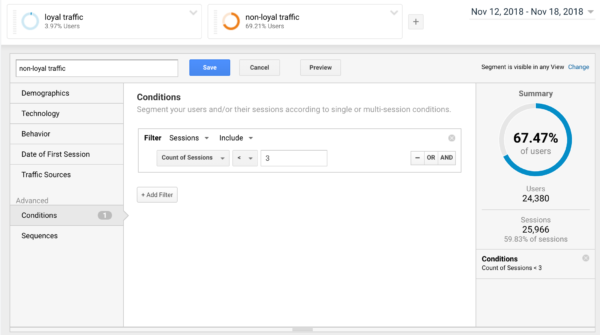
- segment 3. non-loyal traffic
If you apply both segments, you can compare them and try your best to understand both audiences. Analyze how these two groups differ; what’s their behavior? What kind of posts do both read? From which categories or tags? Understand the differences, so you can adjust your marketing strategy based on these findings.
3. Traffic sources
Knowing where your traffic is coming from and analyzing how visitors behave per traffic source, is very valuable. Checking the country they’re coming from, the pages they land on from each source, the device they’re using to go to your site, all these things tell you something about your audience. Looking at traffic sources and going beyond the information you find in the ‘Acquisition’ section in Google Analytics gives you so much more insight than sticking to aggregated reports.
Looking at traffic from search engines says a lot about your SEO. There’s a predefined segment in Google Analytics that will only show traffic from search engines:
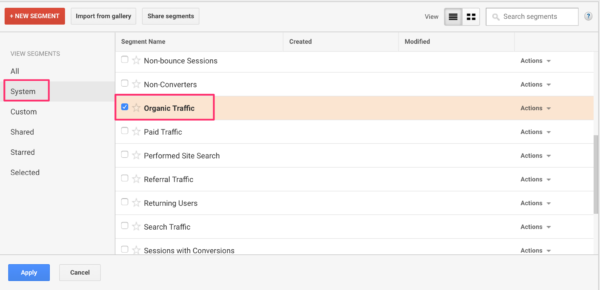
- segment 4: organic traffic
And looking at your traffic from social media sources says a lot about what works on social and what doesn’t. So you can adjust your social media strategy. Building this segment is a bit more work because you have to identify your social media sources. And there are different ways these sources are recognized by Google Analytics. So a good first step is to check the ‘Network Referrals’ report in Google Analytics to see which social networks you can include in the segment.
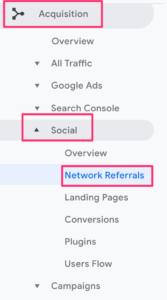
The following is an example of a social traffic segment:
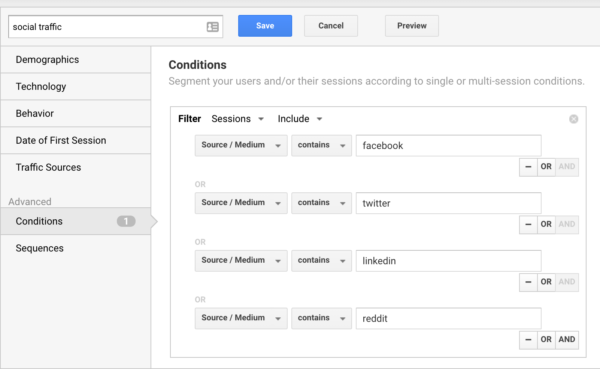
- segment 5: social traffic
As you can see, I’ve used the OR statement so that traffic has to follow one of these conditions.
Don’t you just love segments? And the cool thing is, you can combine the segments in one segment. Specifying your data even more.
Conclusion
Specifying your data gives you so much more valuable information about your audience than aggregated data. There’s a lot you can do to specify your data, one of those ways is by segmenting. Creating a segment might look scary but you can take these blog segments as an example to create your own. All that without having to code! Start analyzing like a pro and get those insights that help you optimize your marketing!
Read more: How Google Analytics wants to help you »