Being a marketer has many challenges, but one of the hardest is reporting and proving your success to higher-ups. You’re often met with questions like, “Well, how is Competitor X doing?” or “How do these numbers compare with industry standards?”
While it’s sadly illegal to hack into your competitors’ marketing reports, there are several tools and resources available that provide data for your specific vertical.
Whether you’re a marketer in retail, hospitality, technology, or non-profit, these resources will help you understand how you compare to your competitors without breaking any laws. Check out the 6 free industry resources below for marketing benchmarking statistics you use to prove (or disprove) your success.
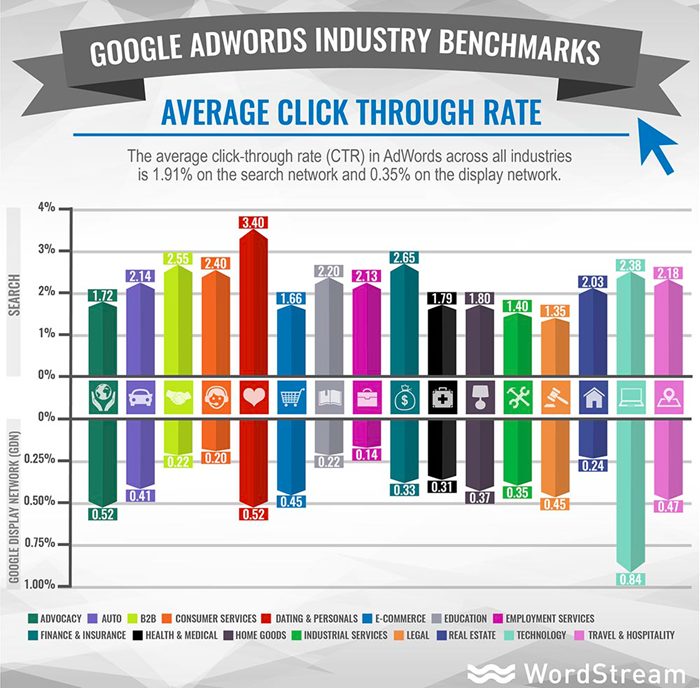
Google AdWords can sometimes feel like a guessing game. You’re throwing all this money into search ads, but are you paying too much for clicks? What is really a good click-through-rate (CTR)?
WordStream’s genius data scientist Mark Irvine put together a list of Google AdWords benchmarks for 20 different industries, which should help you answer the questions above and more.
So whether you want to know your industry’s average CTR, Cost per Click (CPC), Conversion Rate (CVR), or Cost per Action (CPA), these benchmarks empower marketers in all these industries to really understand how they stack up in the pay-to-play world of AdWords. (Check out our Facebook advertising benchmarks too!)
For those of you who haven’t heard of MailChimp, email marketing is what they do. They also happen to email 15 million users each month! MailChimp used their huge library of email data to share email benchmarks for various industries, and they assured us that their data is pure.
“We only tracked campaigns that went to at least 1000 subscribers, but these stats aren’t pulled from a survey of giant corporations with million-dollar marketing budgets and dedicated email-marketing teams,” says MailChimp. “Our customers range from one-person startups to Fortune 500 companies, so the whole spectrum is represented in this data.”
Check out this awesome report where they share average open, click, bounce (soft and hard), abuse, and unsubscribe email rates for 46 different industries!
HubSpot is sitting on mounds of marketing data. This report was created specifically to give marketers access to demand generation benchmarks in their industry, including industry data around website traffic, marketing qualified leads (MQLs), annual revenue, email open rates and CTR’s, and marketing investments. Talk about insider information!

Note that the report, while free, is a gated download so you will have to fill out a form.
Fractyl is a Florida-based marketing agency that works with a variety of customers like AutoNation, ebay, and DirectTV. Recently they conducted a study looking across 300 campaigns to gain an understanding of what content resonated most across 15 different verticals from 2013 to 2016.
“We analyzed each project’s engagement levels (number of placements and social media shares), as well as content characteristics, such as asset type,” says Fractyl.

As you can see, content in the health & fitness and drugs & alcohol verticals tend to get the most social shares (how’s that for competing natures?) with the ever-sexy travel industry not far behind.
The other thing that I love about this resource from Fractyl is that they do an in-depth analysis of the best performing content in each vertical, and share tips on how you can get there.
Rival IQ is a social media toolset that allows marketers to boost social media ROI. Similar to the other providers of industry research, Rival IQ has a large amount of data at their fingertips when it comes to their area of expertise.
To gather benchmarking data on social media Rival IQ looked at channel-specific rankings, engagement, post type, and hashtags across Facebook, Instagram, and Twitter.
According to Rival IQ:
Companies were selected from our database of over 100K companies, and filtered based on industry. Each company included had to meet the following criteria:
*Facebook Fans between 25K and 1M as of December 2016
*Active on Facebook, Twitter, and Instagram as of January 2016

Since social media is still a new beast to many marketers, this type of industry-specific data can be extremely insightful, not just for comparison reasons, but also to understand what to post and how often posting on different channels can yield success.
As you’re likely aware, keyword research is a critical component for many aspects of marketing, from targeting your search and display campaigns to optimizing blog posts for SEO.
WordStream’s Free Keyword Research Tool has been around for since 2011, but marketers always need more data around keywords that pertain to their industry. Luckily, the tool just received a complete makeover. One the of the best improvements is the ability to tailor your results for industry and geography.

If you were ever wondering what keywords your competitors are bidding on, wonder no more! This free tool will solve this problem! Simply enter a keyword or website, select your industry and country, and the results will show you the search volume, competition, CPC, and opportunity score for various keywords relevant to your business.
For example, if you run a search for “cars” in the “autos & vehicles” category, you’ll only get results relevant to car sales, dealerships, rents, etc. Run the same search in the entertainment industry, and you’ll get results related to the Disney movie instead.

These six free resources will help you step out of the shadow and start outshining your competitors with added intel for your industry.
About the Author:
Margot is a Customer Success Manager at Wistia. She loves all things digital, and spends her free time running, traveling, and cooking. Follow her on:
Twitter: @ChappyMargot
Google+: +Margot da Cunha

