Right when you think you’ve grasped your demographics, buyer habits and social advertising strategy, something new changes and turns your data into old news. That’s why it’s so important for marketers to stay up to date with the latest social media statistics.
Don’t believe us?
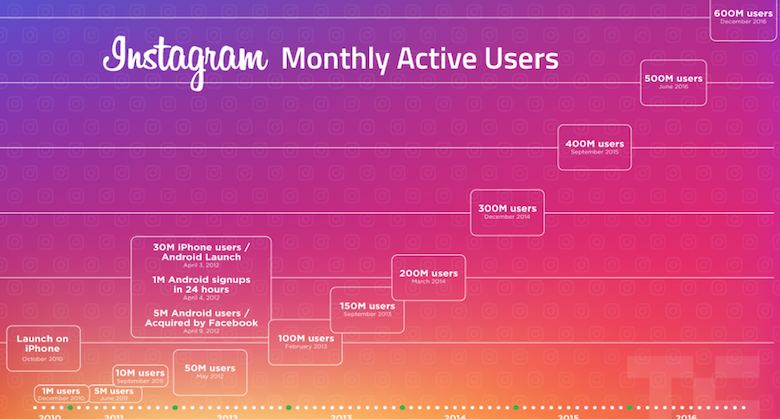
Statista recorded new Twitter users grew by 43 million year over year in 2014, but only by 9 million in 2016. On the other hand, new Instagram users increased by 150 million year over year in 2014 and has since successfully grown by 100 million new users each year.
While these social media statistics might not be shocking, it does show how the landscape of the industry drastically changes in a just a few years. To help you out with your current social media marketing efforts, we’re going to get you up to date on the newest stats and trends within the social media world.
Here are the 61 most essential social media statistics for 2018 and beyond (Click below to jump to each section):
Facebook Statistics
Facebook isn’t going anywhere, but some statistics are changing yearly. In fact, the Sprout Social Q1 2017 Index discovered Facebook still sees the most interactions and is the preferred network among millennials, Gen Xers and baby boomers. Even Instagram’s massive increase in users falls to the power of Facebook.
- Less than half of 12 to 17 year-old US Facebook users will log on at least once per month in 2018.
- Almost 60% of US internet users selected Facebook to watch videos online in Dec. 2017.
- Facebook still reigns as the most popular social media network with 79% of internet users in the US logging on the site.
- Facebook is estimated to generate $21.57 billion in US ad revenues in 2018, which would account for 83% of the total social media ad spend throughout the nation.
- 68% of US adults between the ages 18-29 are on Facebook.
- Daily Facebook visitors grew by 6% year over year from 2015 to 2016 to equal more than 1.6 billion users.
- More than 33,000 chatbots are active on Facebook.
- 100 million hours of video is viewed daily on Facebook.
- There are more than 50 million businesses using a Facebook Business Page.
- Facebook ranked second in a December 2017 survey of senior ad buyers in the US as the platform to drive the most ROI. Google Search was named No. 1.
- Facebook ad revenue in the US is expected to outpace total print ad spending by 2019.

Instagram Statistics
Instagram’s growth and recurring success shows why it’s one of the most powerful social media networks. Since the beginning of 2016, Instagram released a new algorithm, 60-second videos, a complete redesign, videos in explore, Instagram Stories, stickers, GIFs and Live videos–all while hitting 800 million users. Not bad for two years work, right?
However, there’s some helpful data that can show you how the networks is doing today–not two or three years back.
- Instagram posts using at least one hashtag receive 12.6% more engagement than posts excluding them.
- Within 10 hours of an Instagram post, users receive 50% of their total comments.
- Of the top brands using Instagram, 60% use the same filter for all content.
- More than 91% of Instagram posts are photos.
- 35% of Instagram users check Instagram multiple times a day and 51% open the app daily.
- Gender comparisons show online females are 38% more likely to use Instagram over men (26%).
- The majority of Instagram users fall between 18-29 years old, which equates to roughly 60% of adults on the internet.
- Nearly a fourth of social media influencers believe Instagram is the top avenue for influencer marketing strategies.
- Mondays are the strongest day to post to Instagram for engagement.
- Instagram drives the most engagement per post compared to any social network–84 times more than Twitter, 54 times more than Pinterest and 10 times more than Facebook.
- Approximately 25% of Instagram ads are single videos..
- Instagram ads grew by 28% in the second half of 2017. There were 134,000 Instagram ads in July 2017, but ultimately hit 171,000 Instagram ads in December.
- Instagram added 100 million users in roughly six months during 2016. This coincided with the launch of Instagram Stories.

Twitter Statistics
Twitter continually gets pushed aside from its competitor, Instagram. However, more businesses are turning to Twitter for faster customer service actions. Advertisers certainly aren’t moving away from the platform as well. It’s still important to know your essential Twitter statistics in 2017.
- Mobile accounts for 86% of Twitter’s ad revenue.
- Twitter is accessed through a mobile device by 82% of its monthly active users.
- 47% of marketers agreed Twitter was the best social media channel for customer engagement.

- Twitter ranked last as a the platform to drive ROI in a December 2017 survey of US senior ad buyers.
- In Q4 2017, Twitter estimated an average of 330 million monthly active users across the globe–a 4% increase from 2016.
- 81% of millennials view their Twitter account on a daily basis.
- Tweets with images are 150% more likely to get Retweets than text-only Tweets.
LinkedIn Statistics
As the world’s largest professional network, LinkedIn continues to grow. With LinkedIn demographics vastly different than most other networks, it’s important to know what’s going on with the channel. More businesses are starting to use LinkedIn as a marketing channel and some of these stats will show why.

- LinkedIn posts with images receive 200% more engagement than text-only posts.
- 98% of LinkedIn posts with images earn more comments than text-only posts.
- 28% of global marketers said LinkedIn was an effective platform for video marketing in December 2017. YouTube was the highest at nearly 79%.
- US marketers polled in November 2017 said LinkedIn was the safest social ad platform for brands when concerning divisive politics or fake news.
- There are more than 450 million LinkedIn user accounts.
- The typical LinkedIn user only uses the network for an average of 17 minutes per month.
- 18% of LinkedIn users only log in once a day.
- Monthly premium accounts make up 39% of total LinkedIn users.
- 94% B2B organizations rely on LinkedIn for content marketing and distribution.
Social Media Advertising Statistics
With algorithms and altered social media feeds, organic engagement is getting much harder for businesses to earn. The push toward social media advertising is no longer an option for most businesses. Here are some social media advertising statistics to be aware of in 2018.

- Mobile accounts for nearly 80% of time spent on social media networks.
- Mobile devices account for more than half of all YouTube views.
- Ad spend on social media is on pace to outgrow TV ad spend for the first time.

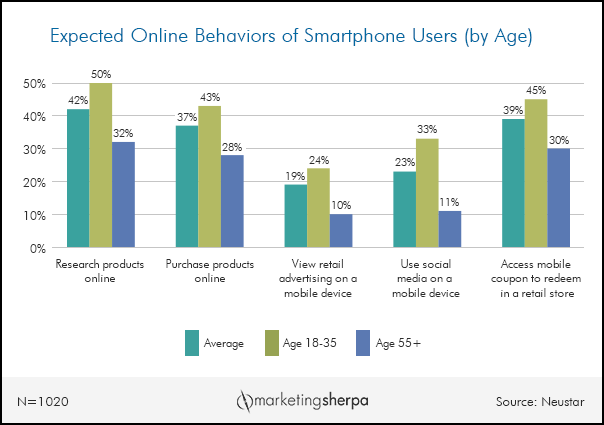
- 50% of millennials use the internet to research products before purchasing.
- 73.4% of users follow a brand because they’re interested in the product or service.
- 46% will unfollow a brand on social for posting too many promotional messages.
- 7 in 10 Gen Xers are more likely to make purchases from brands they follow on social.
- Instagram saw $595 million in mobile ad revenue in 2016.
- Facebook ad revenue increased by 59% year over year in Q3 2016.
- There are more than 2 million businesses advertising on Facebook.

Social Media Engagement Statistics
When discussing social media engagement, it’s critical for businesses to think about their customers. More than ever, users demand brand interactions and if the company doesn’t respond on social, it’s easy to lose customers.
That’s why engaging, conversing and contacting customers via social media can have tremendous payoffs.

- In 2012, the average internet user had three social media accounts–now the average is closer to seven accounts.
- 79% of social media users have shared a life milestone on social media.
- 97% of adults between the ages 16-64 say they logged onto at least one social network in the past month.
- 30% of millennials engage with a brand on social at least once a month.
- Social media and messaging accounts for roughly 1 in every 3 minutes users spend on the internet.
- 89% of social media messages to brands go ignored.
- The average response time for a brand to reply on social media to a user is 10 hours, while the average user will only wait 4 hours.
- The top choice for a customer care channel is social media.

- Millennials and Gen Xers are twice as likely to follow brands on social than baby boomers.
- 32% of Gen Xers interact with brands at least once a month, which is higher than millennials (30%) and baby boomers (14%).
- 1 in 3 consumers would mention a brand when sharing a personal milestone or accomplishment on social media.