April was a big month for Google Data Studio (GDS), with Google introducing some significant product updates to this already robust reporting tool.
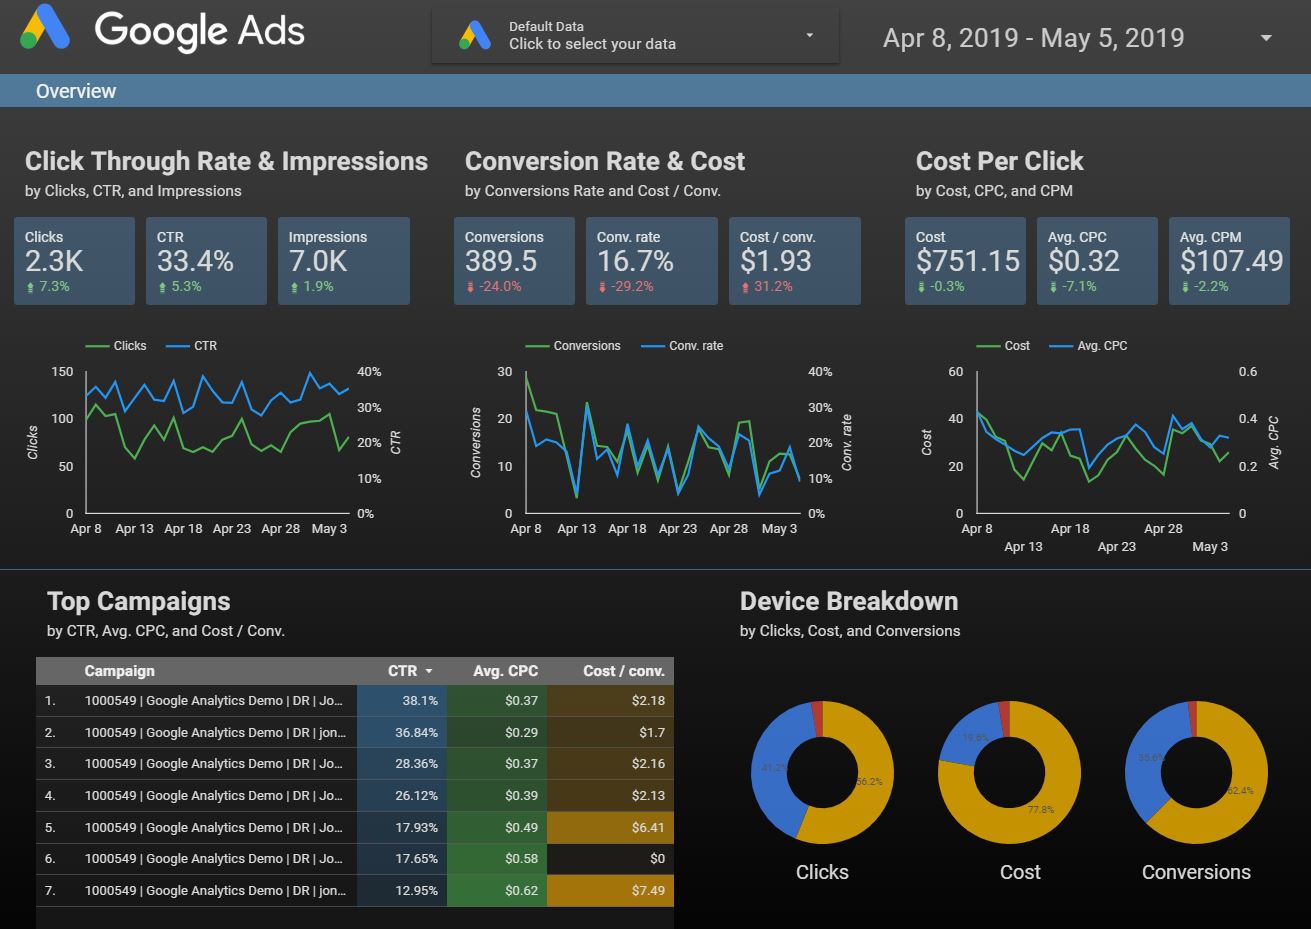
For those not familiar with GDS, it is a free dashboard-style reporting tool that Google rolled out in June 2016. With Data Studio, users can connect to various data sources to visualize, and share data from a variety of web-based platforms.
GDS supports native integrations with most Google products including Analytics, Google Ads, Search Ads 360 (formerly Doubleclick Search), Google Sheets, YouTube Analytics, and Google BigQuery.
GDS supports connectors that users can purchase to import data from over one hundred third-party sources such as Bing Ads, Amazon Ads, and many others.
Source: Google
1. Google introduces BigQuery BI Engine for integration with GDS
BigQuery is Google’s massive enterprise data warehouse. It enables extremely fast SQL queries by using the same technology that powers Google Search. Per Google,
“Every day, customers upload petabytes of new data into BigQuery, our exabyte-scale, serverless data warehouse, and the volume of data analyzed has grown by over 300 percent in just the last year.”
Source: Google
2. Enhanced data drill-down capabilities
You can now reveal additional levels of detail in a single chart using GDS’s enhanced data drill down (or drill up) capabilities.
You’ll need to enable this feature in each specific GDS chart and, once enabled, you can drill down from a higher level of detail to a lower one (for example, country to a city). You can also drill up from a lower level of detail to a higher one (for example, city to the country). You must be in “View” mode to drill up or drill down (as opposed to the “Edit” mode).
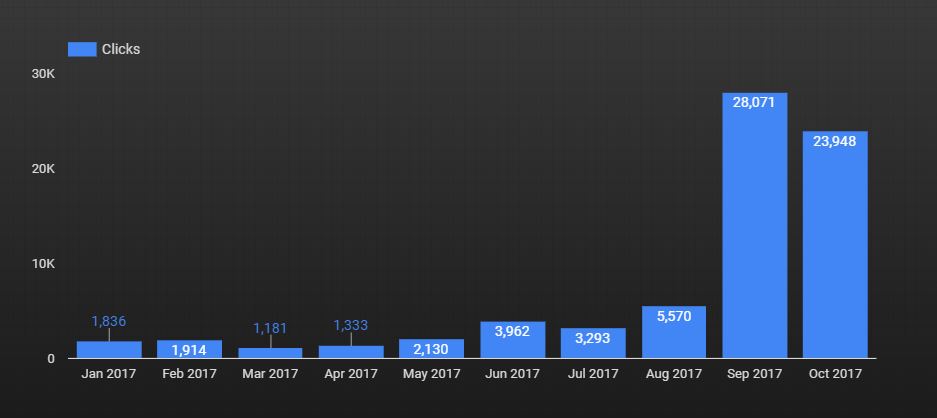
Here’s an example of drilling-up in a chart that uses Google’s sample data in GDS.
Source: Google
To drill-up by year, right click on the chart in “View” mode and select “Drill up” as shown below.
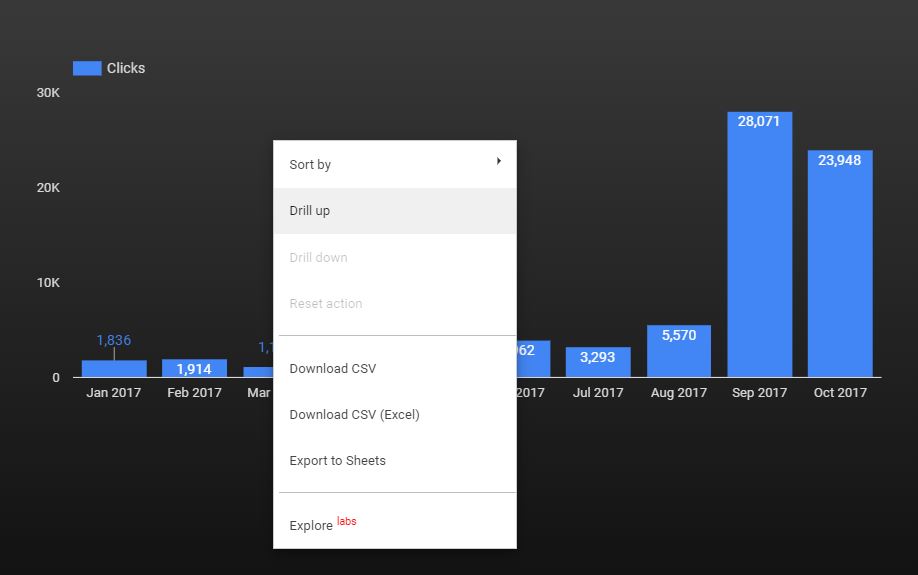
Visit the Data Studio Help website for detailed instructions on how to leverage this feature.
3. Improved formatting of tables
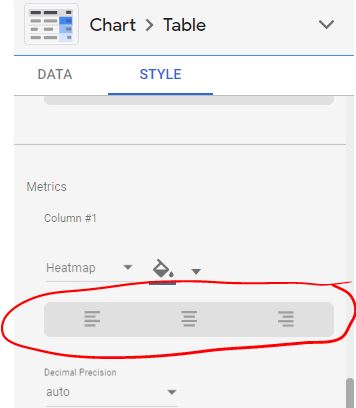
GDS now allows for more user-friendly and intuitive table formatting. This includes the ability to distribute columns evenly with just one click (by right-clicking the table), resizing only one column by dragging the column’s divider, and changing the justification of table contents to left, right, or center via the “Style” properties panel in “Edit” mode.
Source: Google
Detailed instructions on how to access this feature are located here.
4. The ability to hide pages in “View” mode
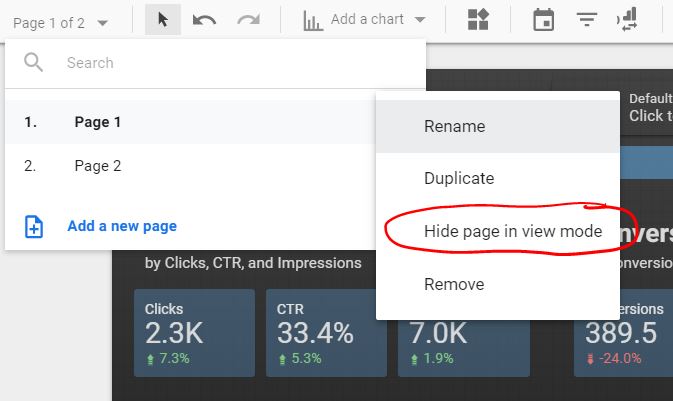
GDS users can now hide pages in “View” mode by right clicking on the specific page (accessed via the top submenu), clicking on the three vertical dots to the right of the page name, and selecting “Hide page in view mode”. This feature comes in handy when you’ve got pages you don’t want your client (or anyone) to see when presenting the GDS report.
Source: Google
5. Page canvas size enhancements
Users can now customize each page’s size with a new feature that was rolled out on March 21st (we’re sneaking this into the April update because it’s a really neat feature).
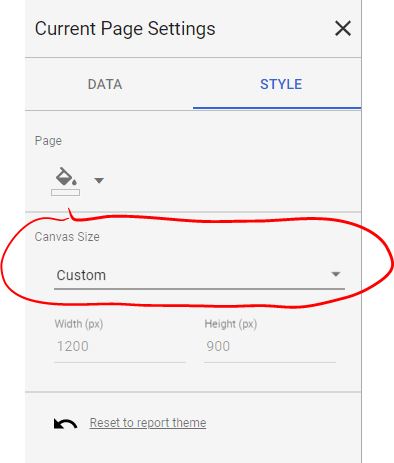
Canvas size settings can be accessed from the page menu at the top of the GDS interface. Select Page>Current Page Settings, and then select “Style” from the settings area at the right of the screen. You can then choose your page size from a list of pre-configured sizes or set a custom size of your own.
Source: Google
6. New Data Studio help community
As GDS adds more features and becomes more complex, it seems only fitting that Google would launch a community help forum for this tool. So, while this isn’t exactly a new feature to GDS itself, it is a new resource for GDS users that will hopefully make navigating GDS easier.
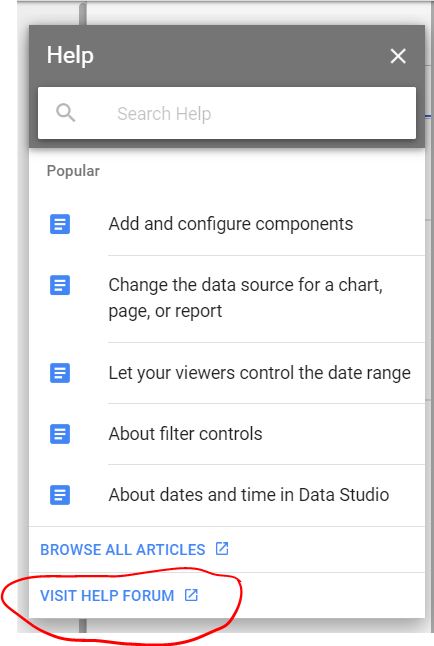
Users can access the GDS Help Community via Google’s support website or selecting “Help Options” from the top menu bar in GDS (indicated by a question mark icon) then click the “Visit Help Forum” link.
Source: Google
Conclusion
We hope that summarizing the latest GDS enhancements has made it a little easier to digest the many new changes that Google rolled out in April (and March). Remember, you can always get a list of updates, both new and old by visiting Google’s Support website here.
Jacqueline Dooley is the Director of Digital Strategy at CommonMind.
The post A summary of Google Data Studio: Updates from April 2019 appeared first on Search Engine Watch.