Google Trends is a free and incredibly useful tool that provides search interests, popular keywords and hot topics in a lot of languages for different platforms such as web search, Youtube or Google Shopping. Regardless of the marketing channel, it can be a very helpful tool to get valuable insights and make meaningful choices for the next steps of your project.
Basically, it gives the data on the relative popularity of a keyword from 2004 to the present, which is really cool! (Relative popularity means the ratio of your search term interest to the interests of all keywords searched on Google.)
Everything is great so far, but analyzing Google Trends data at scale is mostly not practical. Many of us don’t use it much because it seems like a tedious job to search for keywords on the website and get data points one by one. So how can we use Google Trends in a more effective way?
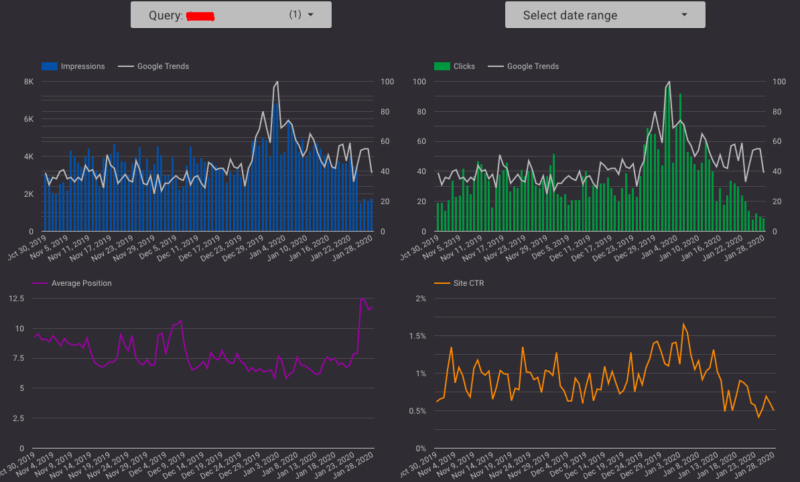
In this article, my aim is to show you the pytrends library in Python and what benefits you can get from it in your data analysis. I will also explain the connection between Google Spreadsheets and Jupyter Notebook in order to import data into Google Data Studio to share it with others easily. For example, while analyzing Search Console data on Data Studio dashboard, wouldn’t it be nice to have Google Trends data on the same page? If your answer is yes, let’s dig in!
3 topics I will cover in this article:
- Coding with Pytrends library and exploring its features
- Connecting Jupyter Notebook to Google Spreadsheets with gspread library
- Importing data into Google Data Studio
System requirements to use the Pytrends Library
- Python 2.7+ and Python 3.3+
- Requires Requests, lxml, Pandas libraries. If you don’t know how to install libraries, check this Python document. (hint: pip install pandas)
- Jupyter Notebook is an open source web application provides the environment to run your code.
Coding with Pytrends Library
First of all, you have to install the library:
pip install pytrends
Importing necessary libraries:
import pytrends
from pytrends.request import TrendReq
import pandas as pd
import time
import datetime
from datetime import datetime, date, time
Now it is time to code!
pytrend = TrendReq()
pytrend.build_payload(kw_list=['tea', 'coffee', 'coke', 'milk', 'water'], timeframe='today 12-m', geo = 'GB')
Payload function is important to specify your search. Write your keywords, decide date range, location and many other things like choosing Youtube or Shopping channel to analyze. In the code above, ‘’today 12-m’’ means one year data. You can narrow your results by specifying location with ‘’geo’.’
Let’s say you have a Youtube channel and you only want to see Youtube search trends. Then your code will be like this:
pytrend.build_payload(kw_list=['tea', 'coffee', 'coke', 'milk', 'water'], timeframe='today 12-m', geo = 'GB', gprop= youtube)
Or let’s assume that you have a food&drink blog and want to get trend data of your keywords in that category, not relative to all searches. Then it will be something like this:
pytrend.build_payload(kw_list=['tea', 'coffee', 'coke', 'milk', 'water'], timeframe='today 12-m', geo = 'GB', cat = 71)
In order to see all features and filters, you should check this repository on Github and also you can find all category codes in here.
(By the way, be careful that you cannot write directly more than 5 keywords in here. It will give an error because you can compare only 5 keywords on Google Trends. I will use another code to analyze keywords more than 5.)
So, let’s keep on and get trends score now.
#to get interest over time score, you'll need pytrend.interest_over_time() function.
#For more functions, check this: https://github.com/GeneralMills/pytrends
interest_over_time_df = pytrend.interest_over_time() print(interest_over_time_df.head())

# Let's draw
import matplotlib.pyplot as plt
import seaborn as sns
sns.set(color_codes=True)
dx = interest_over_time_df.plot.line(figsize = (9,6), title = "Interest Over Time")
dx.set_xlabel('Date')
dx.set_ylabel('Trends Index')
dx.tick_params(axis='both', which='major', labelsize=13)

Suggested keywords
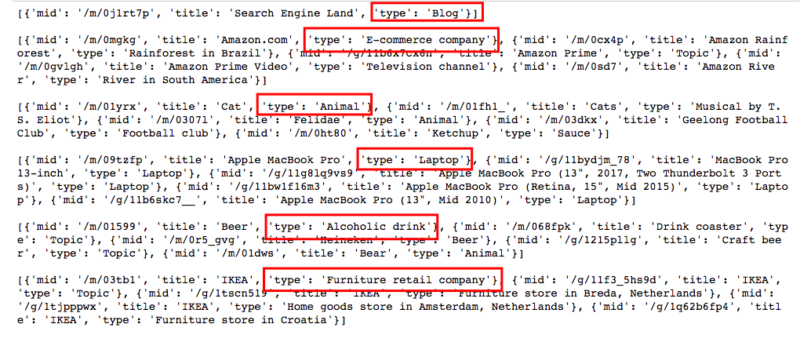
Now I will show you another cool feature of Google Trends. If you use the suggestion function, it will return with suggested keywords and their ‘’types.’’
print(pytrend.suggestions(keyword='search engine land'), 'n')
print(pytrend.suggestions(keyword='amazon'), 'n')
print(pytrend.suggestions(keyword='cats'), 'n')
print(pytrend.suggestions(keyword='macbook pro'), 'n')
print(pytrend.suggestions(keyword='beer'), 'n')
print(pytrend.suggestions(keyword='ikea'), 'n')

Related queries
This is my favorite! Especially because it can be really helpful in Google Ads, keyword research and content creation.
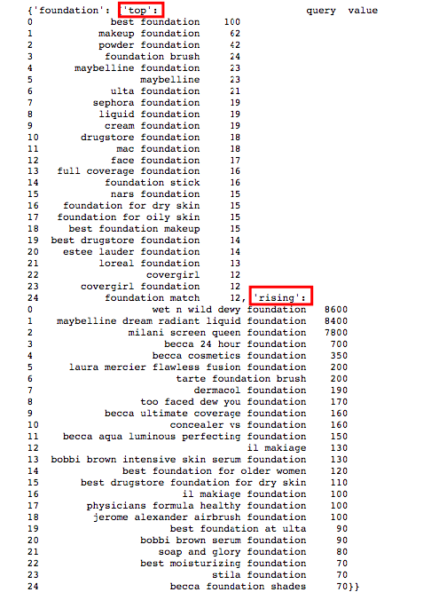
Let’s check ‘’foundation’’ keyword in the Beauty category and get related keywords.
pytrend.build_payload(kw_list=['foundation'], geo = 'US', timeframe = 'today 3-m', cat = 44)
related_queries= pytrend.related_queries()
print(related_queries)

You will see two parts in the output; top keywords and rising keywords. The value of top keywords shows Google Trends score from 0 to 100. However, the value of rising keywords shows how much interest in the keywords have increased in percentage.
If a website sells foundations, it would be great to follow what people are searching for lately, right? These products might be getting popular or reverse, they might have a bad reputation lately and that’s why people might search for them. For instance, noticing this as soon as possible in Google Ads may prevent you from spending excessive amounts of money with no conversion.
Tracking lots of keywords
Now, I will write a group of random keywords here and get their data. You can also read keywords from a csv or excel file but make sure that its type must be a ‘’list.’’
searches = ['detox', 'water fasting', 'benefits of fasting', 'fasting benefits',
'acidic', 'water diet', 'ozone therapy', 'colon hydrotherapy', 'water fast',
'reflexology', 'balance', 'deep tissue massage', 'cryo', 'healthy body', 'what is detox',
'the truth about cancer', 'dieta', 'reverse diabetes', 'how to reverse diabetes',
'water cleanse', 'can you drink water when fasting', 'water fasting benefits', 'glycemic load', 'anti ageing', 'how to water fast', 'ozone treatment', 'healthy mind', 'can you reverse diabetes', 'anti aging', 'health benefits of fasting', 'hydrocolonic', 'shiatsu massage', 'seaweed wrap', 'shiatsu',
 'can you get rid of diabetes', 'how to get rid of diabetes', 'healthy body healthy mind', 'colonic hydrotherapy', 'green detox', 'what is water fasting', '21 day water fast', 'benefits of water fasting', 'cellulite', 'ty bollinger', 'detox diet', 'detox program', 'anti aging treatments', 'ketogenic', 'glycemic index', 'water fasting weight loss', 'keto diet plan', 'acidic symptoms', 'alkaline diet', 'water fasting diet', 'laser therapy', 'anti cellulite massage', 'swedish massage', 'benefit of fasting', 'detox your body', 'colon therapy', 'reversing diabetes', 'detoxing', 'truth about cancer', 'how to remove acidity from body', '21 day water fast results', 'colon cleanse', 'fasting health benefits', 'antiaging', 'aromatheraphy massage']
groupkeywords = list(zip(*[iter(searches)]*1))
groupkeywords = [list(x) for x in groupkeywords]
dicti = {}
i = 1
for trending in groupkeywords:
pytrend.build_payload(trending, timeframe = 'today 3-m', geo = 'GB')
dicti[i] = pytrend.interest_over_time()
i+=1
result = pd.concat(dicti, axis=1)
result.columns = result.columns.droplevel(0)
result = result.drop('isPartial', axis = 1)
result

Yes! I have all of them, but I need to reshape my data frame in case of merging this data with Search Console.
result.reset_index(level=0, inplace=True)
pd.melt(result, id_vars='date', value_vars=searches)

result.to_excel(‘trends.xlsx’)
Google Trends data is ready to go!
Connecting Jupyter Notebook to Google Spreadsheets with gspread library
First of all, you need to enable some APIs and create a secret client JSON file in order to authorize Google Sheets access. I will not explain this in this article, but here is a great guide explaining how to do that step by step.
Then you can just use these codes below:
import gspread
from oauth2client.service_account import ServiceAccountCredentials
links = ['https://spreadsheets.google.com/feeds',
'https://www.googleapis.com/auth/drive']
credentials =
ServiceAccountCredentials.from_json_keyfile_name('ENTER-YOUR-JSON-FILE-NAME-HERE.json', links)
gc = gspread.authorize(credentials)
Creating and opening a spreadsheet:
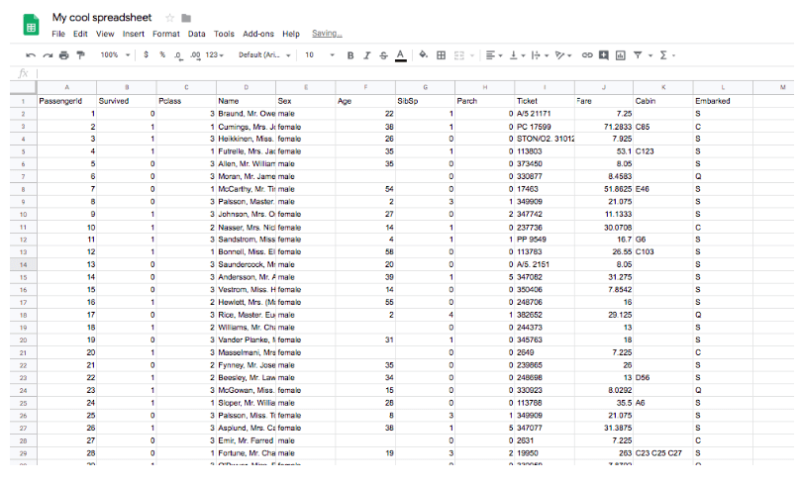
sh = gc.create('My cool spreadsheet')
wks = gc.open("My cool spreadsheet").sheet1
# check colab documents here for more examples →
https://colab.research.google.com/notebooks/io.ipynb
Creating a custom formula to send data frames into sheets :
#https://www.danielecook.com/from-pandas-to-google-sheets/
def iter_pd(df):
for val in list(df.columns):
yield val
for row in df.values:
for val in list(row):
if pd.isna(val):
yield ""
else:
yield val
def pandas_to_sheets(pandas_df, sheet, clear = True):
# Updates all values in a workbook to match a pandas dataframe     if clear:
sheet.clear()
(row, col) = pandas_df.shape
cells = sheet.range("A1:
{}".format(gspread.utils.rowcol_to_a1(row + 1, col)))
for cell, val in zip(cells, iter_pd(df)):
cell.value = val
sheet.update_cells(cells)
An example to see how it works:
df = pd.read_csv("train.csv")
pandas_to_sheets(df, wks)

Let’s continue with trends data and merge it with Search Console data.
sh = gc.create('GoogleTrends')
wks = gc.open("GoogleTrends").sheet1
pandas_to_sheets(result, wks)
dx = pd.read_excel('Trends.xlsx', sheet_name='Sheet1')
dz = pd.read_excel('Trends.xlsx', sheet_name = 'console') #my console data is here, make sure where yours is
dm = pd.merge(dx, dz, on = ['Query', 'Date'])
dm

And let’s send this one also into Google Sheets.
wks = gc.open("GoogleTrends").sheet3
pandas_to_sheets(dm, wks)
Importing data into Google Data Studio
Now you can just connect this spreadsheet with Google Data Studio:

Tracking rising keywords
pytrend.build_payload(kw_list=['foundation', 'eyeliner', 'concealer', 'lipstick'], geo = 'US', timeframe = 'today 3-m', cat = 44)
related_queries= pytrend.related_queries()
dg=related_queries.get('lipstick').get('rising')
dg

Use pandas_to_sheets again. Import these into Data Studio and visualize:

Wrapping up
It seems complicated at first, but just try these codes and create your own dashboards. Because at the end, you will just run the code on Jupyter Notebook and refresh the data on Google Data Studio. It will take only 10-15 seconds to update all of them, I promise!
Here is my Github repository for all Python codes together.
Happy coding!
Opinions expressed in this article are those of the guest author and not necessarily Search Engine Land. Staff authors are listed here.

