Get out your wallets, CMOs, because chances are you will be spending more on marketing in the next twelve months. In fact, a recent survey by CMO Survey (that’s right—all these folks do is survey and gather data from CMOs like you) gathered answers from over 300 Chief Marketing Officers and collectively reported an average 8.9 percent projected increase in marketing dollar spend over the next year. That number’s in the double digits if you are in healthcare (13 percent), technology (12.4 percent) or energy (21.4 percent).
Beyond this general indication of needing deeper marketing pockets, there are loads of other interesting points in this year’s results. Let’s take a look.
How Much Is Too Much?
Everything is relative, so let’s talk about ratio. The study let us know that on average, a firm’s marketing budget is 11.1 percent of its overall firm budget. This is up from 8.9 percent in February 2011. Compared to revenue, marketing budget is 7.9 percent proportionally. The big spender here is consumer goods, which reports 21.9 percent of total revenue going to marketing budget alone.
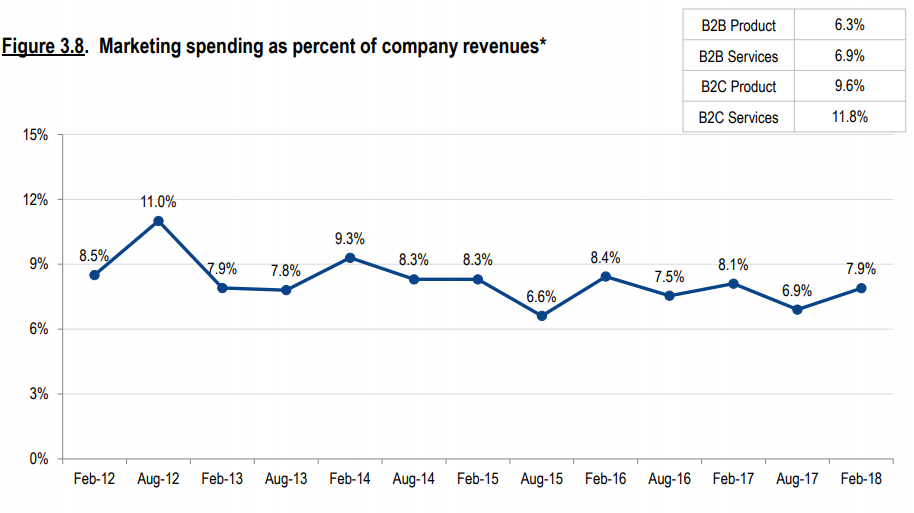
That means businesses that ended the 2017 fiscal year with a solid $10 million in revenue are planning to spend $790,000 to market their businesses in 2018. That also means for every $1 million in revenue, $79,000 will be spent on marketing (on average).
This leads to the first introspective moment of this post: How do you fit into that ratio? Are you spending that much? More likely, you are spending less than that and wondering why your competitor is outpacing you in growth.
Where Is All That Money Going?
Growth in digital marketing spend is greatly outpacing traditional. In 2018, as digital grows, we see traditional spend shrinking by -1.2 percent. This is consistent across all market sectors.
Social media spend has grown 243 percent since 2009. This translates into an anticipated increase in social media spend by 71 percent in the next five years. That is a huge amount of projected growth! It also indicates a larger acceptance of trust in social media messaging delivery which has taken years to establish.
It is important to note that this increase correlates to an acknowledgment of the significant role e-commerce plays in the larger business models for most organizations. Obviously, this particular objective lives online, so the rise in social media marketing is in direct correlation.
Additionally, this increase in spend in the coming years signifies a leap of faith for many. At the same time, the survey reveals that internally, CMOs are fighting an uphill battle. The perception that social media actually contributes to a company’s performance is low (3.3 on a scale of one to seven). This begs the question, why spend so much on social?
Marketing spend on social media has grown a whopping 243% since 2009. Click To Tweet
Why Spend It on Social Media?
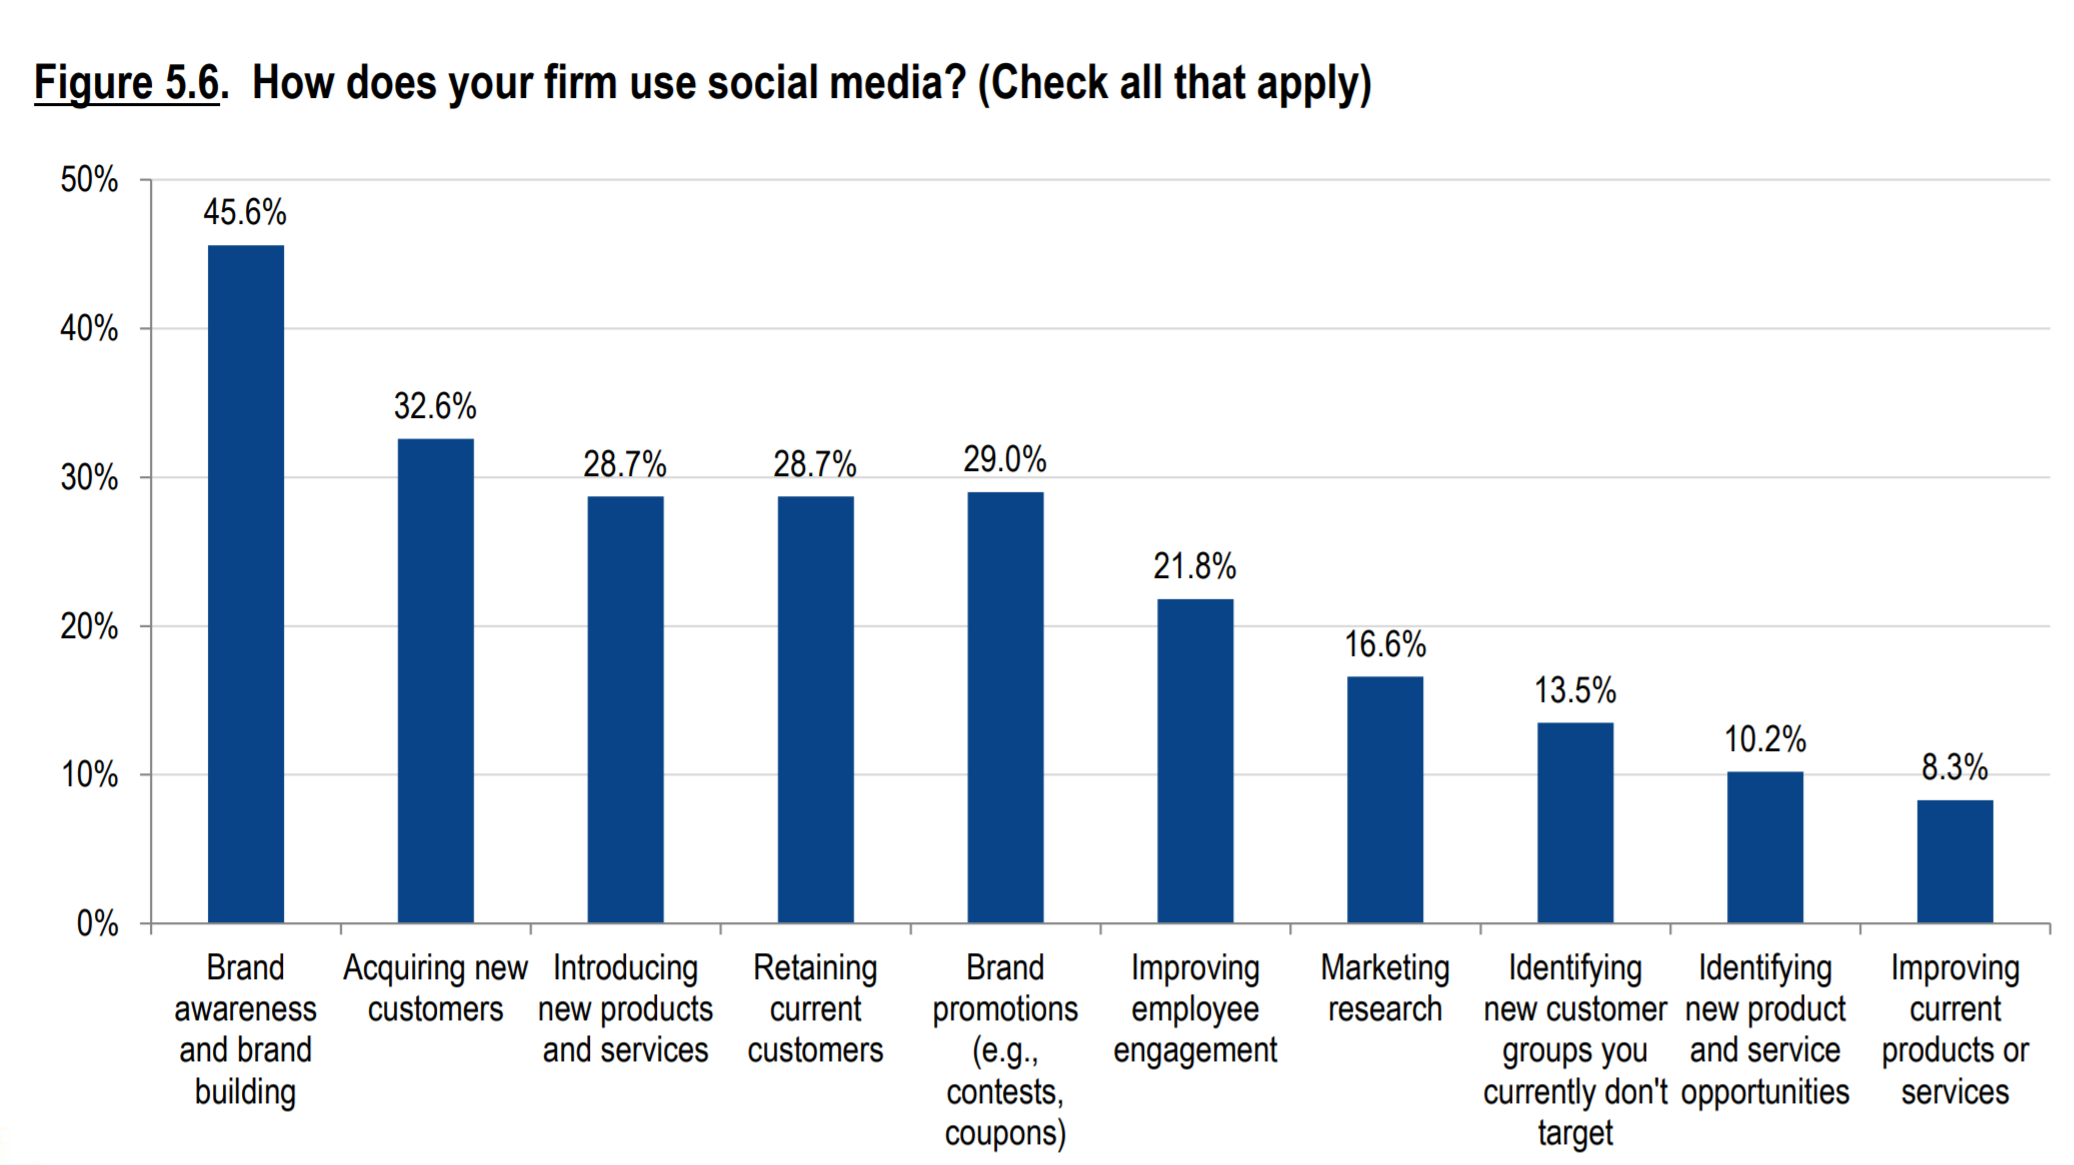
The three hundred CMOs surveyed reported that the top reasons their firms use social media are brand building and brand awareness. This shows a glaring under-appreciation for the value of social media to not only build brand equity but to aid in achieving actual business objectives.
One such objective is customer retention. For years, brands that move at the speed of social in response to customer needs have increased brand loyalty. So while CMOs say they are using social media for awareness now, expect to see a shift over the next five years toward greater social usage for customer service and informational syndication to aid retention. After all, it is always better (and cheaper) to keep a customer than acquire a new one.
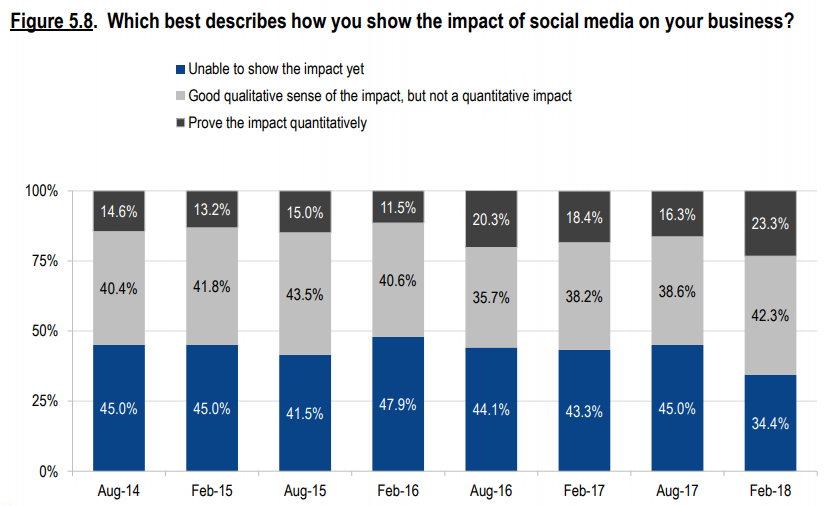
Of course, if you are a CMO, and your organization doesn’t see value in where you plan to increase your budget, proving the impact of the investment takes priority. As this research proves, firms have improved their ability to prove the quantitative impact of social media. Firms are capturing that “measurable results unicorn” better than ever before. 23.3 percent of survey respondents report they’re now quantitatively measuring social media impact, up from 14.6 in 2014. Data like this will only bolster the case for growth in the years ahead.
Impact Needs to Be Measured
While results measurement matters more than ever, current marketing analytics spend shows some fluctuation but no consistent increase over the past five years. That’s going to change considerably in the coming years. Spending on marketing analytics is forecasted to increase 198 percent in three years. That’s a huge increase and a wise move. Over 42 percent of those surveyed use marketing analytics in their decision-making, which raises some concerns about the 58 percent of respondents who are not using analytics. If they aren’t using data, what are they using?
It’s Still About More and More Mobile
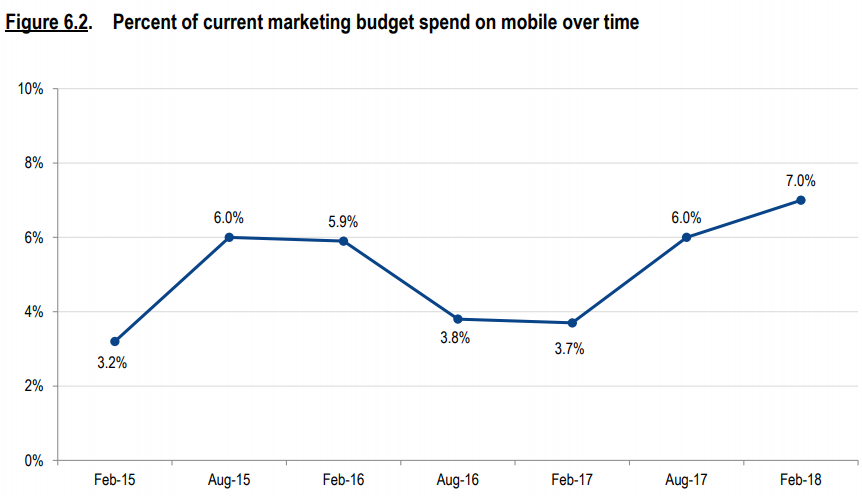
It is hard to believe we could be using our phones more than we already do, but survey projections suggest otherwise: The percent of marketing budget spent on mobile trends upwards over the next three years. In fact, marketing spend on mobile is expected to increase by a full 93 percent. That includes not only mobile ads but also geo beacon content, SMS text programs, augmented reality applications, and more. Mobile marketing offers huge opportunities in the years ahead for innovation by targeting consumers and pushing them closer to purchase consideration.
Predicting the future is a tricky business. And much like our work at Convince & Convert, we look to comprehensive data to help us understand patterns and variances to glean predictive knowledge. This CMO survey gives us a glimpse into the future.
We recognize that this survey represents a sample, and of course, every organization is unique with its own set of challenges and objectives. But there is value in learning from others’ intentions for the marketing years ahead. How does this survey compare to your plans?