Think of a piece of content your team published recently. On a scale of 0 to 100, how would you rate it? And how would your rating help your company?
Stumped? Consider the method that Jared Whitehead devised for scoring content performance.
Jared works as an analyst in the marketing operations group at Red Hat. After 10 years of growth and acquisitions, the B2B technology company found itself in “constant chaos” with its approach to content.
Leigh Blaylock, who manages Red Hat’s global content strategy group and worked with Jared, notes the company “had so many acquisitions, so many products, so many marketing teams” that no one knew what content was meaningful and what content to say no to.
Last year, Jared, Leigh, and their colleagues set out to get Red Hat’s content under control. They wanted to figure out what content they had, what they wanted to keep, what was and wasn’t performing, and what “performing” even meant.
Here’s how they did it:
- Built a content-scoring team
- Standardized content types
- Audited the content
- Developed a content-scoring method
- Created a proof of concept
And here’s what they continue to do:
- Find enthusiasts to promote their scoring method
- Evolve the content-scoring method
- Audit the content regularly
Red Hat’s new content-scoring method is proving its business value by giving content teams a consistent way to assess the performance of individual pieces of content so everybody knows what content to say no – or yes – to.
Content scoring gives teams a consistent way to assess #content performance, says @marciarjohnston. Click To Tweet
Leigh and Jared shared this initiative in their Content Scoring at Red Hat: Building and Applying a Repeatable Performance Model presentation at the Intelligent Content Conference.
1. Build a content-scoring team
Jared describes two schools of thought on how to build a content scorecard:
- A content group develops a scoring method that others follow.
- A cross-departmental group develops a scoring method that works for all.
Either approach can work. Choose what makes sense for the people and content in your situation. Either way, pick people to contribute to the performance scoring methodology who have the big picture of the content and have a sense of the systems used for creating, tagging, distributing, and managing that content.
Pick people to create performance scores who have the big picture of the content or people. @jaredwhitehead Click To Tweet
For Red Hat, this meant Jared involved the marketing content team, which has the big picture of the company’s marketing assets and content systems from brand, to product marketing, to corporate marketing. Team members could say, “This is our CMS, this is our taxonomy. This is how we would get to the content to analyze it. These are the tools available to us. This is how we might use them to get what we’re looking for.”
When you have people who understand the content to score and the systems supporting that content, you have a better sense of the other skills needed on the team. For certain things, you may want to hire help; for other things, employees may be natural choices.
Red Hat hired a librarian, Anna McHugh, to join the team. Jared and Leigh refer to her as the project’s rock star. “She sees all the marketing assets,” says Leigh. “She knows what’s available, and she does a tremendous job of analyzing those assets.”
Jared adds, “I could write a novel about Anna’s role. She has become a curator in addition to a librarian. And an analyst. She does ALL the things.”
2. Standardize your content types
The Red Hat team started the initiative in 2012 by standardizing its content types – white papers, data sheets, infographics, etc. – across the marketing organization. It wanted all business units to have a common understanding of each type of content the company produces.
To accomplish this foundational governance work, Red Hat invited a representative from each marketing team to participate on a core team that developed standards for the types of content they worked on.
If you approach content scoring as a cross-functional team, as Red Hat did, you need to standardize content types across departments. If, on the other hand, you’re a single content group developing a scoring method, you don’t need to gather representatives from the other groups but you still need to standardize the content types in your group.
If you approach #content scoring as a cross-functional team, standardize content types. @marciarjohnston Click To Tweet
3. Audit your content
Next, the Red Hat team cleaned its house with a content audit. Its resource library – external-facing content repository on redhat.com – had grown to more than 1,700 assets. Leigh, Jared, and Anna didn’t know which ones were outdated or irrelevant, but they knew they had a lot of cleaning to do. “It was like having a space full of dust,” Leigh says, “causing visitors to get a sinus infection and leave, never wanting to return.”
They had to figure out a way to identify – and get approval to remove – the dusty content assets owned by multiple groups who invested time and money in those assets. They found 419 content assets more than 18 months old, listed those assets on a shared sheet, identified owners, and asked them to decide which assets needed to remain available.
Since the team couldn’t expect content owners to go through all those assets at once, they did a rolling audit over several months, looking at 25 assets per week. Each week, they sent an email to the content owners of each piece, giving them one week to justify any piece to keep in the resource library. Leigh explains:
We didn’t want a simple keep-it-in-there or no. We wanted to understand why they wanted to leave it in there. Was it being used in a nurture campaign or promotion? If so, we could sometimes suggest an alternative.
Eventually, by weeding out the ROT (redundant, outdated, trivial content), they reduced the 1,700-plus assets to 1,200.
4. Develop a content-scoring method
After cleaning up shop, the Red Hat team turned its attention to analyzing the remaining 1,200 content assets. Jared created a content-scoring method to apply across all content types and content groups.
Since all marketing groups used the same web analytics platform, Jared used that tool to learn what was important to them. His findings showed these important metrics by content type:
- Blogs – time on a page or percentage of page scrolled
- Videos – times people press play or percentage of the video viewed
- PDFs – number of downloads
In other words, depending on the group or the content type, people had various ways of determining, “We’re winning. We’re doing our job.” It was up to Jared to devise a universal way of scoring content performance. He needed to get everyone speaking the same language.
That lingua franca of numbers had to work for people who love the geeky aspects of analytics as well as for those who prefer plain English: Did this content work or not? Did it do what we wanted it to do?
Jared devised a scoring method that gives each content asset an overall score between 0 and 100. This number is derived from four subscores – Volume, Complete, Trajectory, and Recency – each of which is a number between 0 and 100. The overall score includes a weighting factor, which accounts for the relative importance of each subscore for a given asset.
Volume
The Volume subscore is a relative measure of traffic. “This number is relative to all other collateral within our resource library. It’s not specific to a particular content type,” Jared says.
The Volume subscore speaks to awareness. It’s a ranking. It shows how many people have seen a given asset compared to the views of other assets on the site.
Example: If a Red Hat web page, which contains a downloadable white paper, receives more traffic than 60% of the other Red Hat web pages with downloadable assets, that web page gets a Volume subscore of 60 out of 100.
Complete
The Complete subscore is the percentage of visitors who download an asset.
Example: If 40 of 90 visitors download the white paper on a given page, that’s a 44% download rate. That page’s Complete subscore is 44 out of 100.
Trajectory
The Trajectory subscore reflects a trend.
Example: In month one, a web page has 900 visitors. Month two, 600 visitors. Month three, 300 visitors. Traffic to that page is declining. At Red Hat, that negative slope equates to a Trajectory subscore of 0.
If visits had increased over those three months, the Trajectory subscore would reflect a positive slope. The higher the slope, the higher the Trajectory subscore.
For example, an asset had 10 visits in week one, 20 in week two, and 30 in week three. The slope (rise over run) of this asset would be 30 divided by three, which equals 10. Here’s how that calculation breaks down:
rise of 30 (10 in week one + increase of 10 in week two + increase of 10 in week three)
over (divided by)
run of three (number of weeks)
Determine the Trajectory scale according to what you hope to glean from the analysis and what is most useful to your organization, Jared says. Each company defines a strong slope differently. For example, if you consider a slope of 10, as shown above, to be strong – interpreting that this asset gets an average 10 additional visitors per week – you might give it 100 points on your Trajectory scale. You can determine your slope point scale arbitrarily (any slope greater than X gets Y points) or you can assess the average slope of all assets and base your scale on that distribution.
The Red Hat team understands that an outlier can affect slope. It could have zero views one month, zero views the second month, and then two views in the third (the outlier). Trajectory is going up. While that’s a positive sign, it doesn’t necessarily indicate steady traffic. Outliers are accounted for in the Recency subscore, which indicates whether traffic was maintained and steady during your analysis window.
Recency
The Recency subscore recognizes assets that maintain their value. Red Hat sets a monthly benchmark goal for each asset. The asset accumulates points based on the number of times it meets the benchmark:
- 40 points if met in the most recent month
- 30 points if met previous month
- 20 points if met two months prior
- 10 points if met three months prior
Example: Red Hat sets a benchmark of 50 downloads for an asset and evaluates the metrics on July 1. The asset’s Recency points break down like this:
- 0 points for June (downloaded 31 times)
- 0 points for May (downloaded 49 times)
- 20 points for April (downloaded 51 times)
- 10 points for March (downloaded 60 times)
The asset’s Recency subscore in July would be 30 points (0 + 0 + 20 + 10) out of the 100 points.
As noted under Trajectory, a Recency score accounts for outliers. A positive Trajectory (numbers climbing every month) could pair with a low Recency subscore if the first two months had notably low numbers (less traffic or fewer downloads). The Recency subscore, Jared says, “provides the gut-check of Trajectory in telling us whether that slope is a fluke due to extremely volatile traffic, or whether that slope is backed by strong, steady traffic.”
Another example would be an asset getting high-volume traffic in months one, three, and four, but little traffic in month two. That asset’s slope still could be positive in the overall calculation, in which case you would never know that the traffic dipped in month two without digging deeper. The Recency score indicates a month of low traffic. “If that was of interest,” Jared says, “we would know to look into that asset immediately.”
Weighting
For each content asset, the four subscores rank differently in importance and are weighted accordingly. In other words, the weighting of subscores is unique to each content asset to emphasize what the team values most about that asset. Each subscore is assigned a weight percentage, enabling the standardized overall scores to take priority variations into account. Because of this weighting, one asset’s overall score can be more usefully compared to another’s.
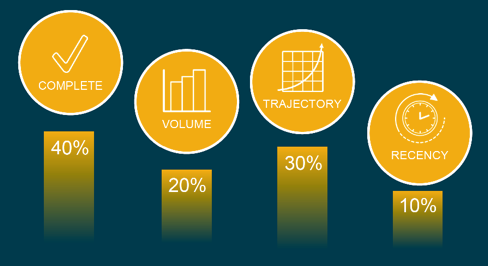
How does weighting work? Say that for a given piece of content Red Hat doesn’t care about traffic (Volume subscore). It wants visitors who arrive at a downloadable asset to say, “Hey, I want to know about that topic. I’m going to download this.” In that case, the Complete subscore matters more than the other subscores. Red Hat weights the Complete subscore higher than the other three, something like this:

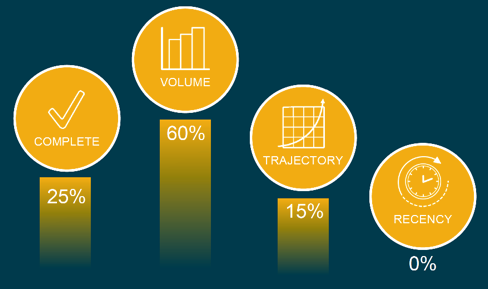
Alternatively, in the case of an awareness piece of content, Red Hat might care about how many people got to the asset (Volume) and might not care about Recency. The weighting percentages for that asset might look like this:

Overall score
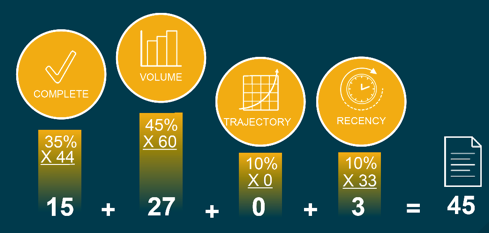
To calculate an asset’s overall score, Red Hat multiplies each subscore by its weighting percentage. In this example, the overall score for the content asset is 45:

The overall score is neither good nor bad. It takes on meaning only when compared to the overall scores of the rest of the content – which is why the score was normalized using weighting percentages. The overall score enables the team to compare various types of content and metrics that would otherwise be difficult to compare.
There’s no absolute scale to indicate what to make of an overall score of 45. If the rest of the content assets average 32, a 45 is fantastic. It means that this piece is doing well. If the content assets average 60, though, an overall score of 45 prompts the team to investigate why this piece of content is not performing as well as its peers.
Leigh says that this scoring method does a lot more than answer the question, “Did it perform well?” The teams can look at the subscores and say, “OK, this piece is getting great Volume numbers, but the Complete numbers are terrible. Are our advertising efforts in the campaign centered on this hitting the right people and getting a ton of traffic, and none of them want this? Is my landing page not effective? What’s going on here?”
A thoughtful scoring method can do a lot more than answer, “Did it perform well?”, says @leighblaylock. Click To Tweet
Pitfalls
Like all scoring methods, this one has pitfalls. For one thing, a low score doesn’t necessarily mean that a piece of content is not working. Scoring is relative. People need training in interpreting the overall scores. Jared gives this example: “When you see a score of 0 to 100, you think of 90 and up is an A, 80 to 90 is a B, 75 is a C. Ours is not a letter-grade method.”
Another pitfall Jared witnessed is that people look only at the score. “The number is not a hard and fast rule. It’s not meant to serve as the only data point for deciding what content to retire. Scores are not a chopping block.”
Scores simply provide one way of estimating the performance of individual content assets. Ultimately, people must consider what’s behind the scores and decide what actions make sense.
5. Create a proof of concept for your scoring method
Content scoring isn’t a quick process, and it requires many stakeholders. How do you get people to spend the needed time on this process – to put aside other work to do it?
Jared and Leigh suggest starting with a proof of concept to show the team what type of new insights can be gained.
Content scoring isn’t a quick process & it requires many stakeholders, says @marciarjohnston. Click To Tweet
Red Hat uses this experimental period to gather feedback from those who will participate in the project. “When you call something a proof of concept, they’re more willing to give you critical, helpful feedback than to just glance over it and say, ‘No, that won’t work here,’” Leigh says.
Red Hat’s proof of concept was built as an analysis sandbox in a workbook of spreadsheets with data from an API on their web analytics platform. After the data was pulled into the workbook, Jared built functions and calculations to summarize the data into an experimental content-scoring model. He then shared this data as CSV files for others to review and comment on.
Once stakeholders approved and reviewed the content-scoring model, the content team presented the model in a roadshow manner: They gave talks to the marketing leadership team and to a few marketing teams to gather feedback and encourage adoption. From there, after more people in marketing understood the model and its potential, Red Hat colleagues began asking Jared, Leigh, and Anna for analyses.
The team designed the proof of concept around the question, “What methodology will give us what we want?” It took a lot of whiteboard sessions and a lot of math. Once they had built (theoretically) what they wanted, Jared set about building it “in a refreshable, active state, so we could test and tweak the model as others were exposed to it.”
The current iteration is not far from that proof-of-concept workbook. Red Hat is moving into a final phase that will include a dashboard utility, refreshed daily, that everyone in marketing can see.
Here’s Jared’s advice for creating a proof of concept:
Start with something. Anything. If you have an idea or a general feel for what you are trying to accomplish, build what you can with what you’ve got. Others have a much easier time understanding your process and goal if they can see and play around with a prototype.
6. Find enthusiasts to promote your scoring method
After your proof of concept and once you have a scoring method, your job has just begun. If you throw your method out there and walk away, “It will die within a month. No one will use it,” Jared says.
You have to be an evangelist. You have to believe that others in your organization could use your method right now. Be willing to walk up to people and say, ‘We’ve got something new that you’re probably not comfortable with yet; we can get you there.’
And you can’t do it alone. Find people in your organization who, when they hear about the scoring method, get excited: “I can use this. This can help me start those conversations that aren’t happening right now.”
Look for subject-matter experts who will understand your scoring method and speak enthusiastically to other content providers and owners. They will argue based on what’s working and what’s not, saying things like “I’m not saying that your white paper or video was terrible or that it was fantastic. I’m telling you what the traffic says.”
It’s hard to argue with a respected person who says, “Here’s what we should do with this content because this is how it’s performing.”
7. Keep developing your scoring method
Your scoring method needs to evolve. Look for opportunities to get new insights on how people are interacting with your content. For example, Red Hat has a lot of data on how many people download its PDFs, but the data stops there. It’s building a business case for using more HTML content, as Jared explains:
With HTML content, we can dive into the asset itself. As opposed to saying just ‘Yup, they downloaded it,’ I want to know, how much time did they spend with that asset? How far did they scroll? We want to bake that type of information into the score.
Consider what kind of insights into your audience you want, and look for ways that your scoring method might provide those insights.
Consider what kind of insights you want & look for ways that your scoring method can help. @jaredwhitehead Click To Tweet
8. Audit your content regularly
Red Hat now audits its content quarterly. “We don’t want to go through all our assets at once again,” Leigh says. Each quarter, the team identifies assets that haven’t been updated in 18 months and those performing in the bottom 20% of the overall scores.
Though content age and score alone don’t tell the team what to archive, that information identifies which assets to consider archiving. “Chances are, that content is not performing well – but maybe it is,” Leigh says. “Maybe two years ago we created an asset that was so forward-thinking that people are just starting to navigate to it and access it.” To filter out pieces like that, the team also notes the Trajectory and Recency subscores.
They then list all the candidates for archiving in a shared sheet, identify the content owners, and give those owners one month to assess which assets can be archived. “We’ve done that now for two quarters, looking at about 65 assets per quarter. I expect that number to go down,” Leigh says.
She adds, “Now 100% of our visitors find exactly what they need 100% of the time.” OK, maybe not, she admits, “but we do have a better chance of satisfying our audience.”
Conclusion
The Red Hat marketing team has been using its scoring method for a year and looks forward to doing more with it. “Lots of teams within Red Hat will benefit from knowing how content is performing,” Jared says. “This goes well beyond the content team.”
Got questions for Leigh and Jared? Got insights of your own to share? Let us know in a comment.
Here’s an excerpt from Leigh and Jared’s talk:
Sign up for our weekly Content Strategy for Marketers e-newsletter, which features exclusive stories and insights from CMI Chief Content Adviser Robert Rose. If you’re like many other marketers we meet, you’ll come to look forward to reading his thoughts every Saturday.
Cover image by Joseph Kalinowski/Content Marketing Institute
