infographics

How blockchain works (infographic)

August 28, 2018 by PwC Tags:  Learn how distributed ledger technology, digital tokens, and smart contracts are rewiring commerce. Blockchain is poised to change how business is done. As a distributed, tamperproof ledger, it doesn’t just cut out intermediaries, reduce costs, and increase speed and reach. It also offers greater transparency and traceability for […]
How blockchain works (infographic) Read More »

How to Repackage Your Old Articles into New Content Assets

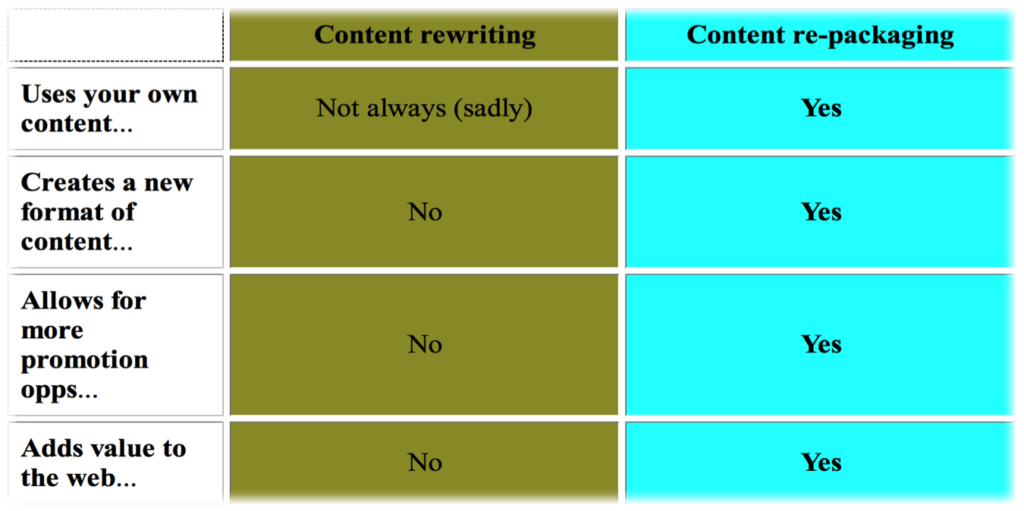
Content repackaging (also referred to as content repurposing and even content recycling) is turning existing content into new formats. More often than not, it involves turning text content into infographics, videos, e-books, etc. I prefer the term “content repackaging” because it reflects the point of the tactic in the best possible way: you actually create a

How to Repackage Your Old Articles into New Content Assets Read More »

How Will Your Business Benefit From The AI Economy? [Infographic]

Artificial intelligence could bring in as much as $13 trillion to the global economy by 2020 – but implementing AI tech comes with many unique challenges due to its distinct nature. By 2030 around 70% of companies could utilize some kind of AI tech and a 16% potential increased GDP of local economies, driven by

How Will Your Business Benefit From The AI Economy? [Infographic] Read More »

How to Differentiate Your Brand On Instagram Stories [Infographic]

By now, you’re likely aware of the growing popularity of Instagram Stories, and its unique ability to reach customers where they already are. With the introduction of Shopping in Stories, it’s even easier for consumers to explore brands, find new products, and make purchases right on the platform. Essentially, shoppable Stories are streamlining the customer

How to Differentiate Your Brand On Instagram Stories [Infographic] Read More »

How a Tax Preparation Business Could Save You From the Next Recession [Infographic]

In less than two years, the United States could face another recession. How do you plan to stay up when the economy is down? Only 27,000 jobs were created in May 2019, and the unemployment rates are expected to increase over the next three years. Meanwhile, the rate of personal income growth is simultaneously falling.

How a Tax Preparation Business Could Save You From the Next Recession [Infographic] Read More »

How Much Time Do Consumers Spend Connected to Digital Media? [Infographic]

As technology evolves over the years so does the reach of digital media. According to recent statistics, the average adult in the United States of America now spends an average of 11 hours and 27 minutes each day consuming digital media. While historically most of that time has been spent watching TV. Now, with changing

How Much Time Do Consumers Spend Connected to Digital Media? [Infographic] Read More »

Programming the Ethics of Artificial Intelligence [Infographic]

By 2050, driverless cars and mobility as a service will grow into a $7 trillion worldwide. So if the millions of people making decisions on the road, how will A.I. handle that? Driverless cars have many benefits and from 2035 to 2045 consumers will regain up to 250 million hours of free time that was

Programming the Ethics of Artificial Intelligence [Infographic] Read More »

6 Steps to Build a Successful Offshore App Development Team [Infographic]

Due to the growing popularity in the use of smartphones across the world, more and more consumers are increasingly becoming dependent on their mobile devices for more than just communication purposes. This has led to many businesses embarking on developing various applications. When it comes to app development, offshore app development is very effective for

6 Steps to Build a Successful Offshore App Development Team [Infographic] Read More »

?
WP Twitter Auto Publish Powered By : XYZScripts.com