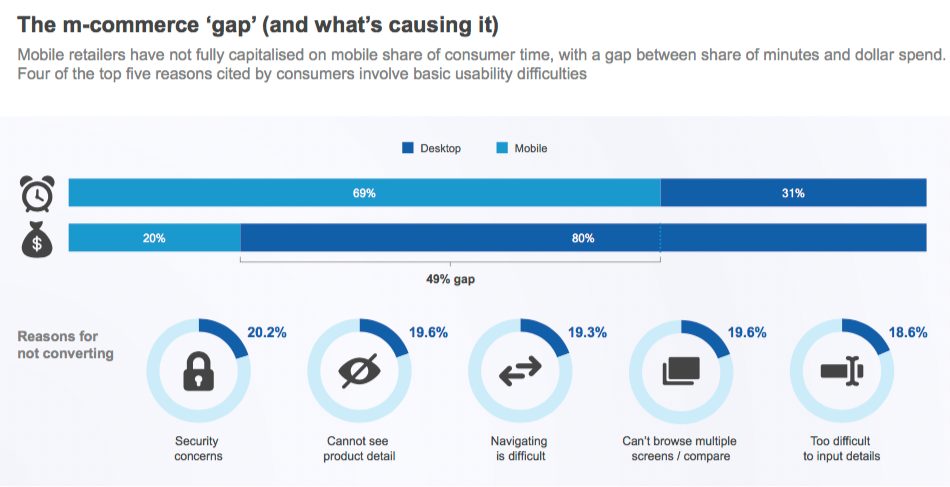
More people browse on mobile but buy via desktop
Chart of the Week: 53% of traffic to online stores comes via mobile devices, but this translates to just 32% revenue While the majority of people browse sites via a mobile device, it seems that the majority of purchases are still made via desktop. According to Wolfgang Digital’s KPI Report 2019, 53% of traffic comes […]
More people browse on mobile but buy via desktop Read More »