If there is one new year’s resolution for boosting ecommerce conversions in 2019, it’s to get your store’s analytics in order. Otherwise, you will never understand the impact of changes to your site. You’ll also miss out on potential target audiences — long-term, loyal customers.
To start, run some reports to help set goals. While you can run these reports again, consider printing them to PDFs to ensure you have the data you need.
Fine-tuning Google Analytics
Google Analytics’ new Lifetime Value report (Audience > Lifetime Value) is in beta, but it can provide an idea of the value of your customers. You can analyze this over time.
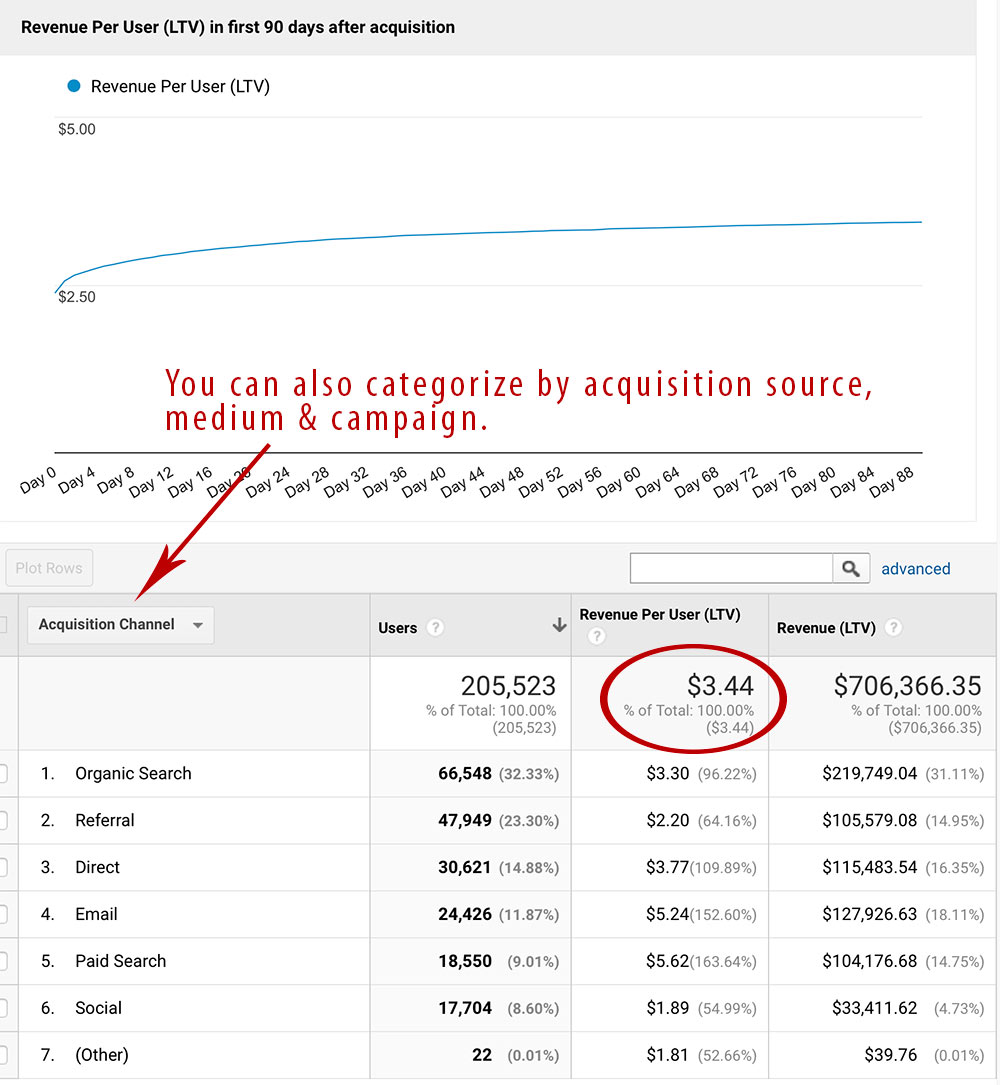
To run the Lifetime Value report click Audience > Lifetime Value and configure the start and end dates. Click image to enlarge.
New vs. returning compares first-time shoppers to returning customers. Ideally, a small percentage of long-time, loyal customers account for a significant amount of revenue. That’s not always the case, though. Thus, work on improving these metrics.
In the example below, returning visitors accounted for 19.09 percent of all users. They collectively had a higher conversion rate, however, although revenue was nearly the same — $420,841.13 for new visitors and $428,942.17 for returning visitors.

Run the New vs Returning report by clicking Behavior > New vs Returning. Set the timeline and select “Ecommerce” at the Explorer tab at the top of the screen.
—
Overall sales and product performances. This provides insight into your store’s revenue, sales conversion rate, and average order value. Product performance shows revenue and quantities sold for each product in your store. You may discover that some products didn’t sell as well as expected. This might indicate problems with pricing, product page features, descriptions, or supporting media.
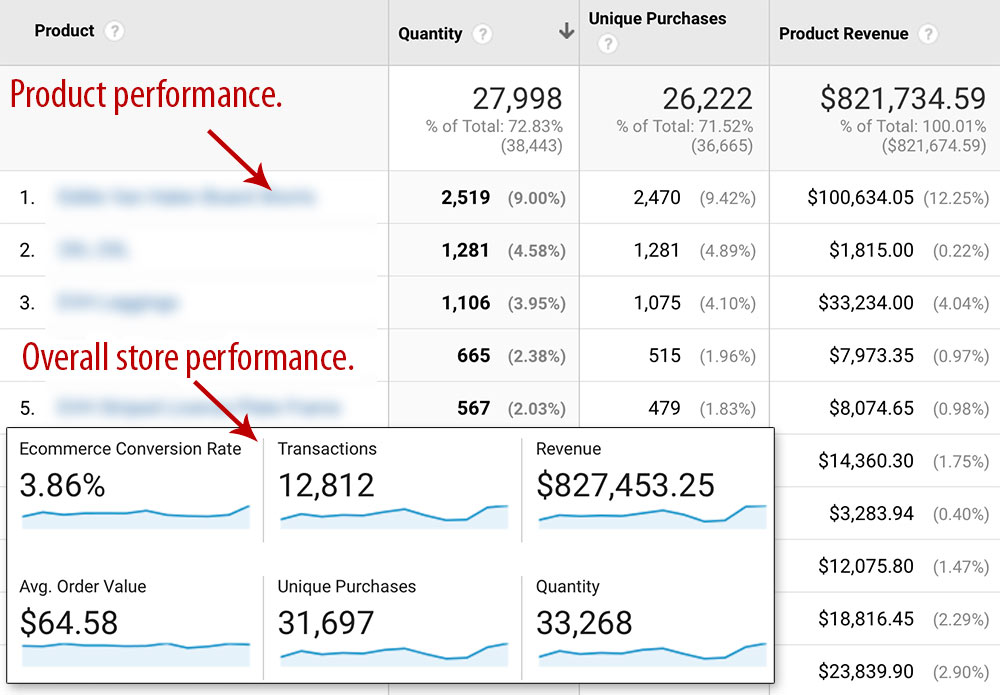
Under Conversions > Ecommerce, look at both the Overview and Product Performance tabs. Click image to enlarge.
—
Product performance and overall store performance represent the core numbers to improve, even if you do nothing to increase traffic. Improvements will likely come from product placement and description changes, updates to page designs, and streamlining the site’s navigation, search functionality and checkout pages. Before making any changes, though, make sure analytics is ready to track what you need.
Here are a few tips to make better use of analytics so you can better identify conversion rate improvements and culprits of sales declines.
- Create and save a custom report for browser and operating system. This gives a snapshot of the devices shoppers use when they make a purchase. If you see popular devices lower on the list, it may indicate a problem with the mobile version of your site.
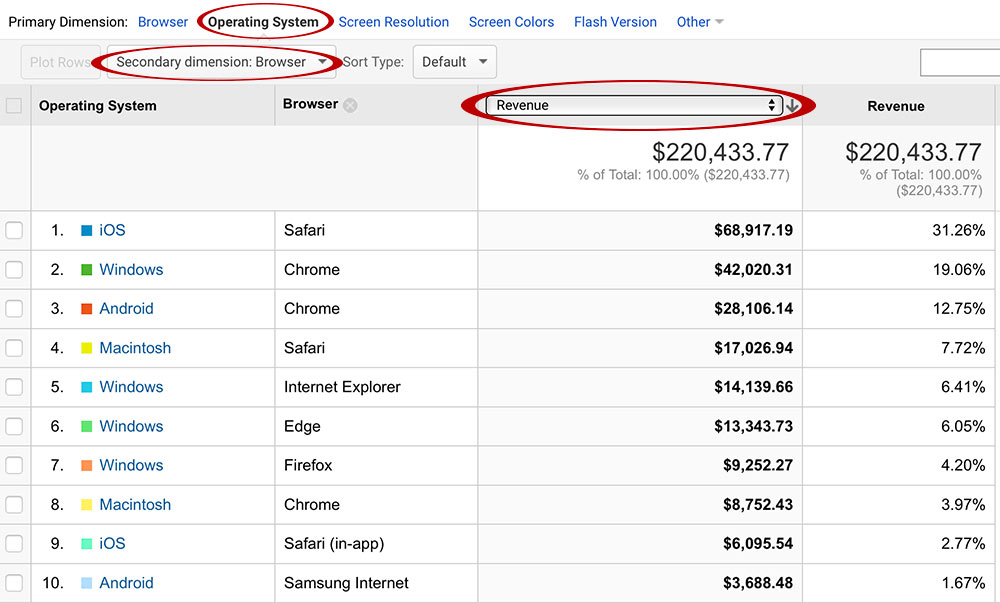
At Audience > Technology > Browser & OS, set the primary dimension as “Operating System” and the secondary dimension as “Browser.” Then click the report to view as a pie chart and opt to sort by revenue. Click image to enlarge.
- Create and save a custom report for reviewing bounce and exit rates. Knowing the bounce rate of key pages can help address items that are causing shoppers from buying. Try using your site’s overall average bounce rate as a baseline to identify pages with the worst problems. For example, if your site’s overall average bounce rate is 45.5 percent, examine all pages that have a bounce rate above 45.51 percent and work on decreasing.
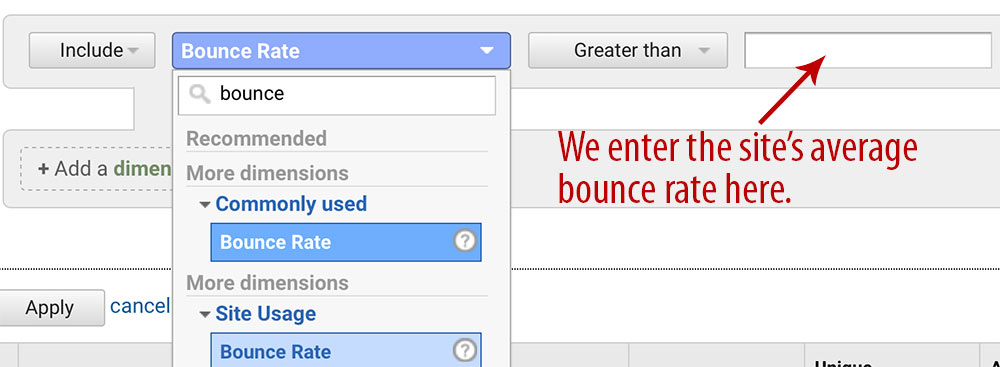
Navigate to Behavior > Site Content > All Pages and click the “advanced” link to include all pages with bounce rates that are greater than the site’s average. Next, click to sort by bounce rate (lowest to highest). Click image to enlarge.
- Create a custom report for site search. If you don’t currently use this report in Google Analytics, set it up. The report can help pinpoint problems with site-search result drop-offs and missing keywords.
Set the filter to include “% Search Exits” that are more than about 10 percent of each of the site’s average and total unique searches. In the example below, the site processed 204 unique searches on a given day, so we set the Total Unique Searches filter to be greater than 20 (approximately 10 percent of 204).
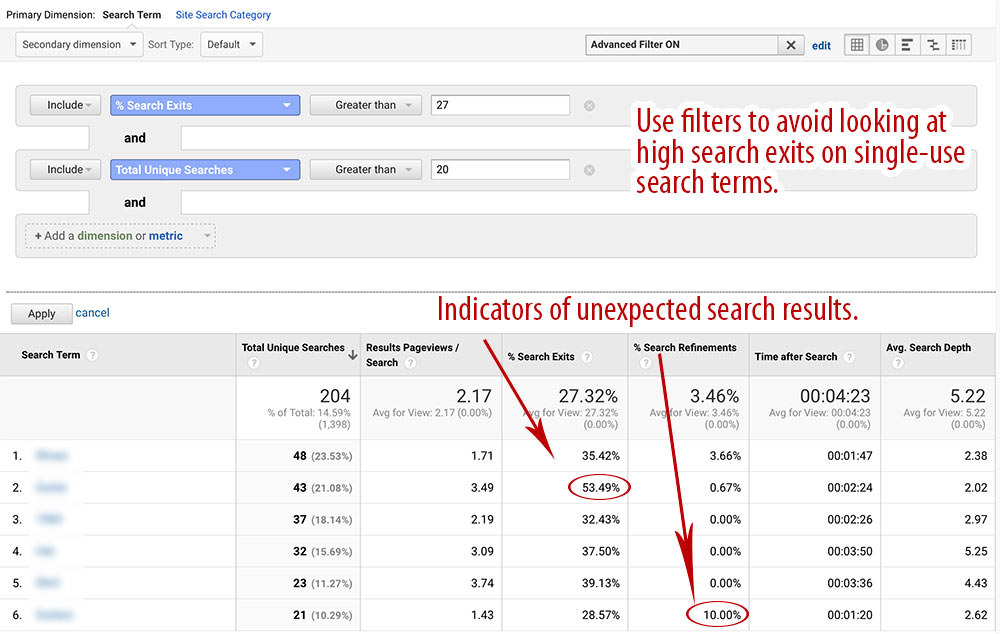
Navigate to Behavior > Site Search > Search Terms to identify keywords used by your searchers. Click image to enlarge.
- Create a custom report for web traffic source vs. conversions. Sometimes the mere source of traffic can reduce average conversion rates. This is most common with referrals from social networks when people click to see a page’s content with no intent to make a purchase. Frequently reviewing results by traffic source may reveal high traffic, high bounce rates, and low conversion rates from specific sources. In Google Analytics, click on Acquisition > All Traffic > Source/Medium. Set the primary dimension to “Source.” At the top of the page click “Ecommerce.”
—
Activate Demographics and Interests at Audience > Demographics and Audience > Interests. Google Analytics can give insight about your site’s visitors. It can tell you the percentage of men and women, as well as the age groups. It can also report the primary interest of your shoppers. We’ve addressed this at “Using Demographics, Interests for More Revenue.”
—
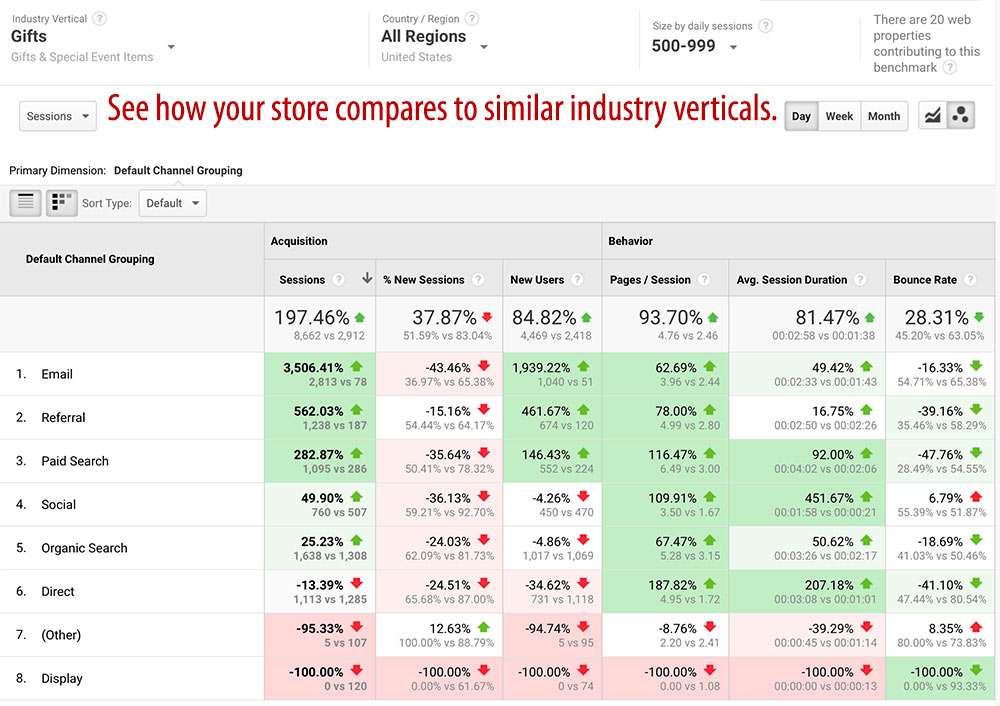
Turn on Benchmarking. Google Analytics’ Benchmarking report lets you see how visitor sessions match up against other businesses in your industry. To use it, you must share (anonymously) your site’s data. It’s a good way to see how off track you might be when it comes to session durations and bounce rates.
Annotate
While there are many other potential configurations (some based on third-party tools) the suggestions above are a good starting point. All that’s left is to implement the changes — in navigation, functionality, layout, design, and prime textual content in site headers and checkout.
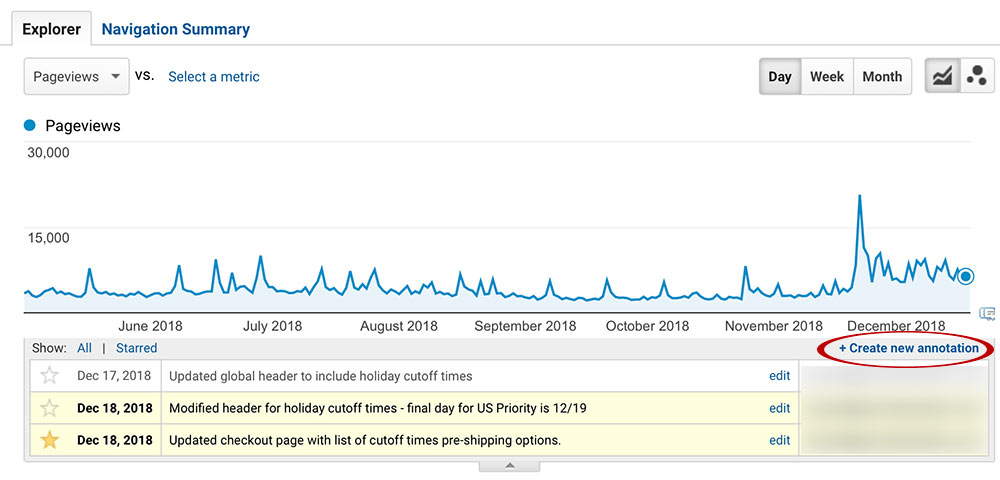
Annotating each change is crucial. It identifies when the change was made, which helps track conversion mistakes and successes.
