Google Search Console has updated the Inspect URL tool with information about HTTP response codes, JavaScript logs, and rendered screenshots.
Users can access this information by logging into Search Console, navigating to the Inspect URL tool, and clicking on “View crawled page.”

A sidebar will then slide in from the right-hand side of the screen where users can click through different tabs to view the new sets of data.
Here is a breakdown of the new information that’s available and why it’s useful.
What’s New in the Inspect URL Tool
HTTP Response Codes
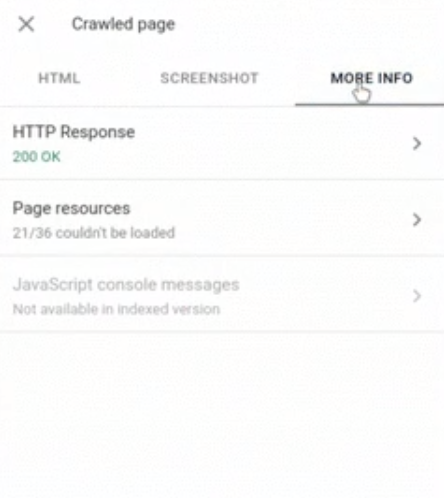
Click on the “More Info” tab to view the HTTP response code for that specific page.

From there you may find that the page is OK (code 200), not found (code 404), moved permanently (code 410), experiencing a server error (code 500), or a slew of other possible status codes.
Blocked Resources
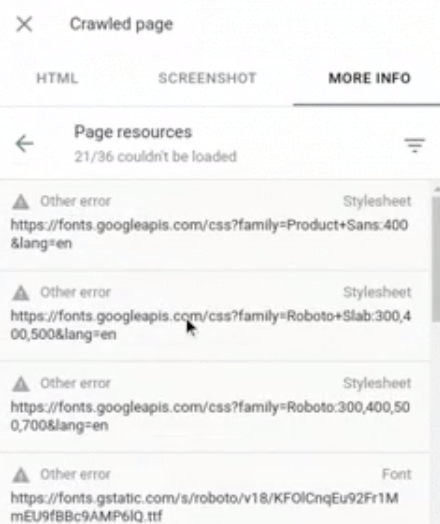
Click on the “More Info” tab, then click on “Page resources.”

From there, you’ll see a list of resources on the page that could not be loaded by Googlebot.
Blocked resources aren’t always a bad thing, but in some cases, they could be harming a site’s SEO.
Search Console ranks blocked resources in order of severity, so users will know if there’s anything that needs immediate attention.
Rendered Screenshot
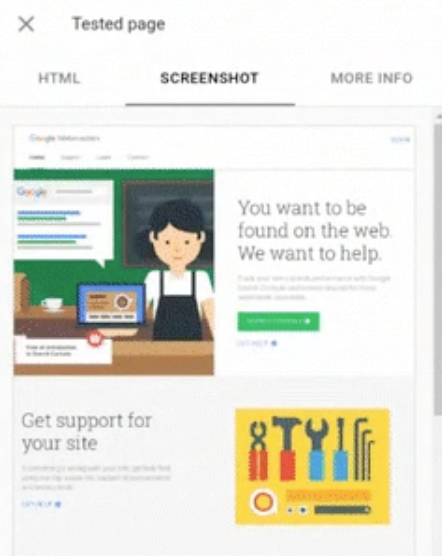
From the “More Info” tab, click on “Screenshot” then click on “Test live URL.”
Search Console will render and display a screenshot.

This is useful as the screenshot is rendered by Googlebot, so users can see what Google sees when it crawls the page.
Users can find out if the page is being crawled as intended, or if any important content is missing.
JavaScript Logs
From the “More Info” tab, users can see if there are any JavaScript console message.
The information will allow site owners to diagnose and debug errors related to JavaScript code.
These updates to Search Console have been rolled out to all users as of today.
More Resources
Subscribe to SEJ
Get our daily newsletter from SEJ’s Founder Loren Baker about the latest news in the industry!
