Google announced some new features within their URL inspection tool found within the Google Search Console. The tool added the ability to see a specific URL’s HTTP response code, the page resources, the JavaScript logs and a rendered screenshot.
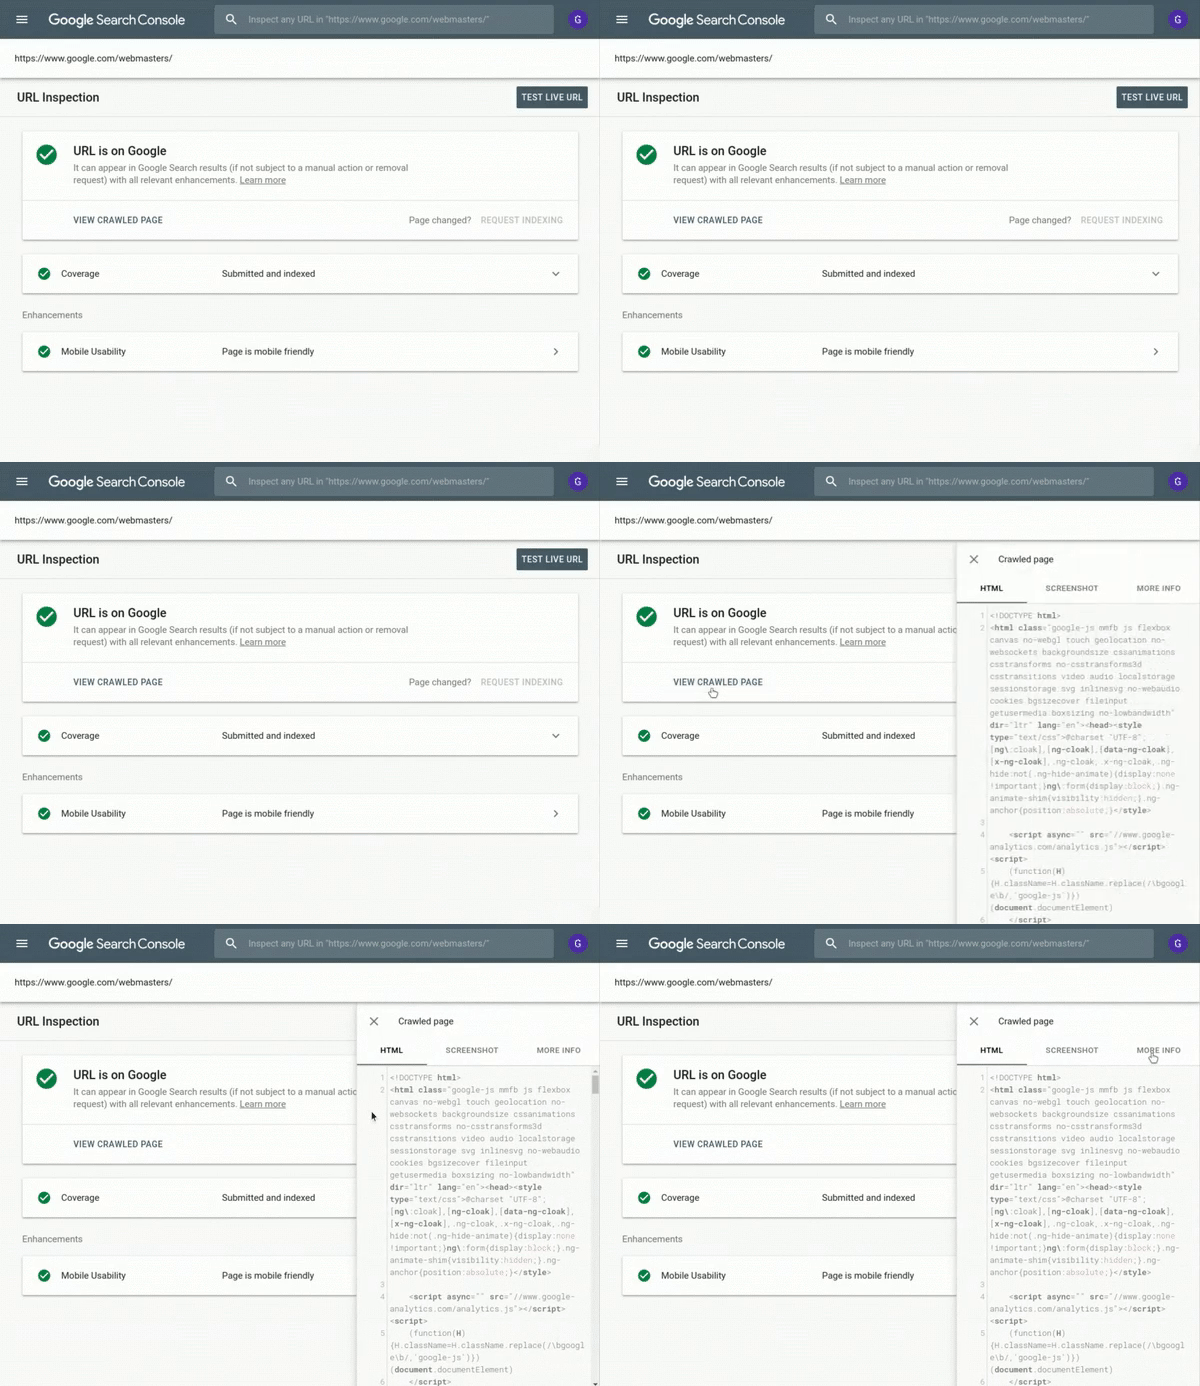
What does it look like? Google shared this GIF showing you how to access and see the new features within the URL inspection tool:
How do I access this? Go to the new Google Search Console, click on the URL Inspection tool, enter a URL and do the live test. It will then give you access to the full feature set within that URL inspection tool.
What is new? Google specifically added the ability to see the HTTP response code, so that you can see if Google sees a 200 OK code, a 404 page not found code, a 301 redirect code or something else. Google will also show you the page resources that Google can and cannot access. Google will show you your JavaScript log and also show you a screen shot of how Google renders the page.
Google wrote on Twitter “You can now see the HTTP response, page resources, JS logs and a rendered screenshot for a crawled page right from within the Inspect URL tool.”
Why it matters. Gaining insight into what Google sees after they crawl and render the page is very useful to SEOs and webmasters. Sometimes developers code pages in a way that might not work too well for Googlebot. This tool can show you those issues in a very specific and actionable manner. You can then use these details to show your developer what needs to be addressed, changed, fixed or adjusted.

