It’s been about 18 months since Google stopped serving paid ads on the right rail of desktop searches.
It’s also been another rapid year of mobile and voice search. With mobile search now accounting for 60% of total search volume and 20% of searches coming from voice, it is easy to say the last few years have really escalated things in the search realm.
One of the things I have been tracking for the last 8 years is the overlap in brands in both the paid and organic listings. Data from multiple studies has always shown an increase in traffic for those brands who rank in both paid and organic. Understanding how well brands have coordinated their strategy in search has always given some unique insight.
This year was no different, and with all the changes in the landscape, it is more important than ever to understand how your brand’s strategy aligns.
Industry swings and roundabouts
After a brief dip last year, the data this year shows the highest amount of brand overlap ever at 25.7% (25.6% in 2015 was the previous high). This data validates two things in my mind:
- As search becomes more established as an industry and tactic, brands have become more aware of the value of coordinating their strategies.
- The changes in how search listings appear favor those bigger brands who have larger paid search budgets and deeper SEO technical and content capabilities.
What was maybe a little more surprising was the big swings in retail and financial services industries. Financial services took a big jump with heavy overlap from terms like “Home Equity Loan” and “Car Insurance.” These terms are some of the most expensive, and therefore only big brands can play right now for these head terms.
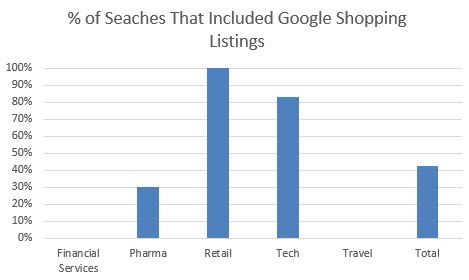
For retail, this drop was related to the decrease in actual paid listings and being replaced with Google Shopping ads (which we did not count in brand overlap). However, you can see below that Google Shopping ads appeared for 100% of searches we did in the study.
Google has amped up their shopping ads especially since they work well for both Google and brands by driving higher CTR and conversion rates than traditional paid search ads. Google shopping is really the 3rd piece of the Google search results page puzzle that brands show be mindful of when optimizing.
Brand presence in local search
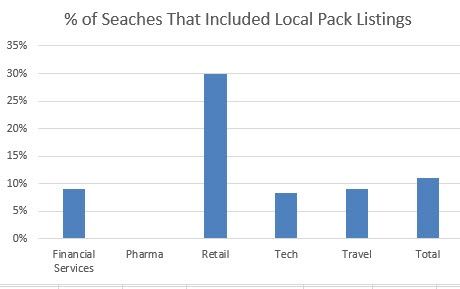
The other piece of data (and the 4th piece of the Google search results page puzzle) we are going to start watching and trending over time is how frequently the Local Map Pack appears.
With mobile phone growth, many consumers are seeing local results because the intent signal that location provides is so high. Retail again lead the way for these terms; however, it is worth noting that all categories other than pharma had some presence of local listings.
Brands need to consider their location data management strategy to improve their eligibility for this part of the search results page. If our experience is anything like yours, this is a spot most companies don’t understand, but progress can be made with some dedicated resources.
In summary, the search results page has more components to it than ever. Next year, we will even be reviewing the knowledge graph and structure answers that will be read by voice assistants.
It’s key that your brand monitors these changes and understand how the various pieces of the Google search puzzle come together. Each piece has value on its own, but having a collective strategy that helps you dominate the page is vital.


