Discover what marketing channels were effective for online stores in Europe and how consumer behavior has changed in 2018
“There is nothing so stable as change,” Bob Dylan once said and perfectly described all areas of life, including business. To stay relevant and successful, you should observe and analyze the current situation on the market. That is why I’m going to share with you some figures that demonstrate what marketing channels were most efficient for e-commerce in east and central Europe over the last year.
Average order value dropped, number of sessions jumped
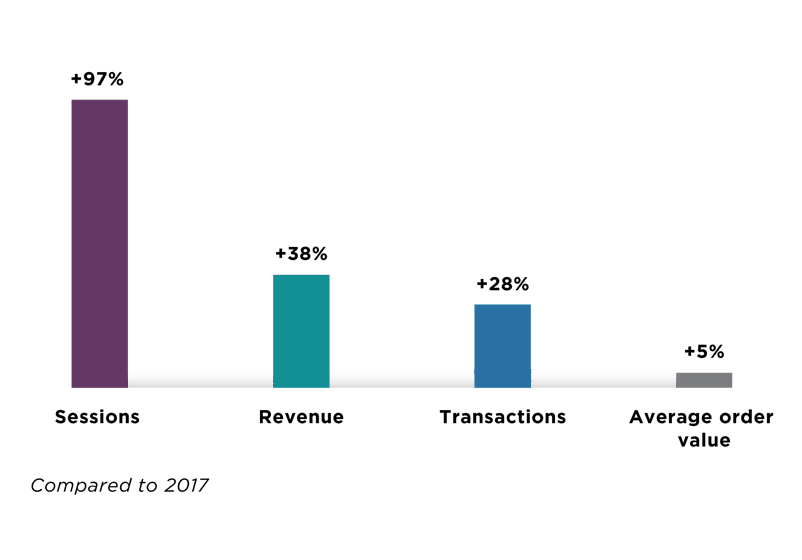
For the CEE e-commerce Report, the Promodo digital marketing agency studied 150 e-commerce websites within 11 niches and found out that the number of user sessions has rocketed by 97% compared to 2017. This progress is almost three times less than in the previous year.
In turn, the number of transactions significantly falls behind the visits volume. Its growth pace keeps almost stable over the past two years. This designates the consumers to follow the “webrooming” behavior – search for products online and buy them in offline stores.
Although the key metrics have notably grown, the average online order value increased only by 5%. In comparison, last year the average value rose by 20% from 2016.
What does that mean for business?
The omnichannel marketing strategy is the overall e-commerce trend since, according to different research findings, consumers trust brands that have both digital and physical stores more than those with only an online store.
Try to integrate your offline and online channels into a single system of making a purchase to help your customers buy products in a way that is more convenient for them.
Customers buy more on websites which load faster
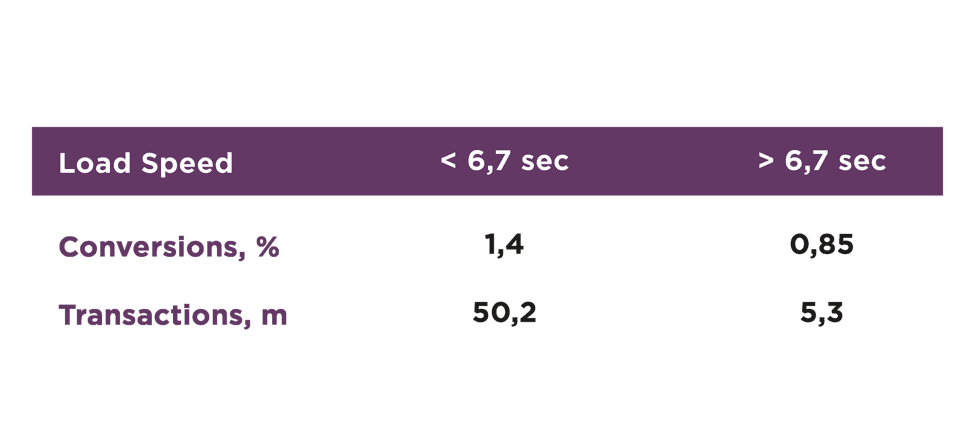
During the last year, Google strongly suggested that website load speed should be below two or three seconds and started rewarding those sites with faster load speeds. However, most online stores only aim for these indicators. Last year, the average loading time of e-commerce site was eight seconds, this year, the mean e-store is loading within 6.7 seconds.
Moreover, the research revealed that websites that load faster than the market average sell nine times more.
What does that mean for business?
The site load speed directly affects the average bounce rate for your site and your position in the search results. You can check your site with Google PageSpeed Insights to learn which pages need to be optimized and ask developers to improve these.
Consumers use a phone to browse and computer to buy
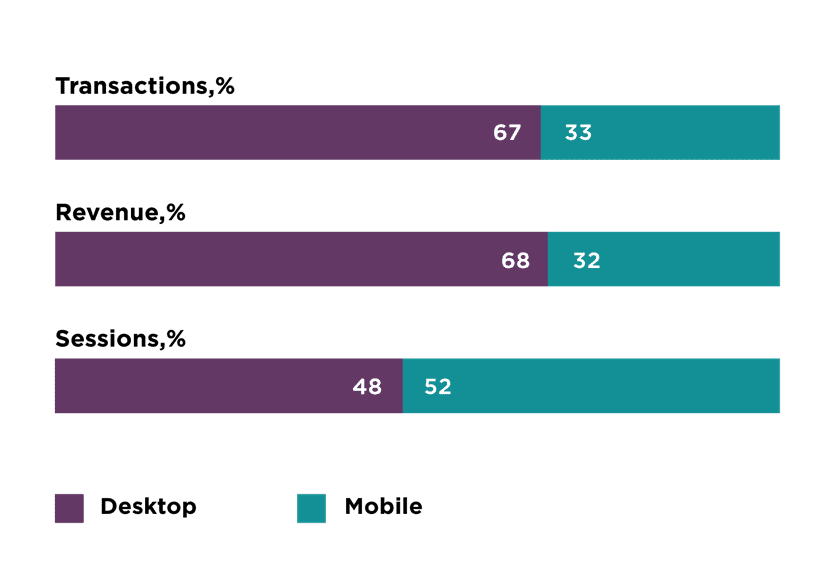
Mobile optimization is the hot-button topiс of recent years. In 2016, traffic from smartphones increased by 71%. Currently, the number of sessions from mobile devices caught up and even surpassed desktop rate. Along with that, users still purchase via PC around twice as frequently as they do via mobile.
What does that mean for business?
Customers spend most of their time on smartphones checking emails and social media, where they get acquainted with new products, as well as view and click targeted ads. A phone is also handier to browse the item that crossed your mind immediately, or for searching for products “on the move.”
Broadly, mobile devices are convenient at the two middle stages of the sales funnel – intent and evaluation. To complete a purchase, it is often more reliable to do so via a large PC screen.
However, the issue with a low transaction rate may lie in different areas of the customer journey. For instance, the website may have an unobvious ordering or payment process, or the mobile version may not save the products added to a cart. If you know what smartphones your audience uses, provide mobile payment integration such as Apple Pay, Google Pay and Samsung Pay to make checking out easier.
Return customers bring four times more revenue
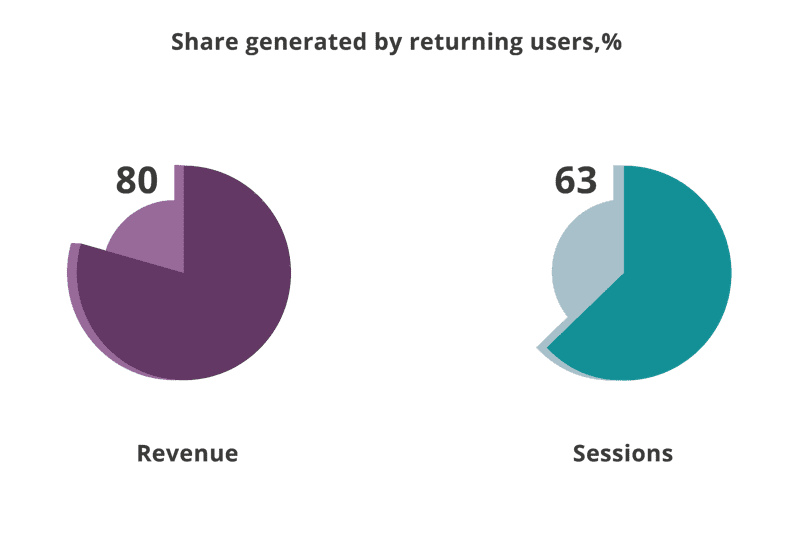
In 2018, loyal clients generated almost 80% of e-commerce revenue, which is by 15% more than in the previous year. This shows that customer retention is a cost-effective strategy, as well as being cheaper than customer attraction. The share of traffic generated by first-come visitors decreased by 12% compared to 2017.
What does that mean for business?
We should invest in customer loyalty, which depends on the range of factors. First thing first, find out what experience your visitors gain when interacting with your e-store. Answer the questions “Is the interface is user-friendly?”, “Is it easy to find the desired product?”, “Is it simple to pay for my order?”, “Do I need to pay for delivery,” “Is the customer support polite? Have they helped me quickly?”. Make sure your unique selling proposition is clear, and you as a customer would prefer to return.
Most shoppers come from paid search
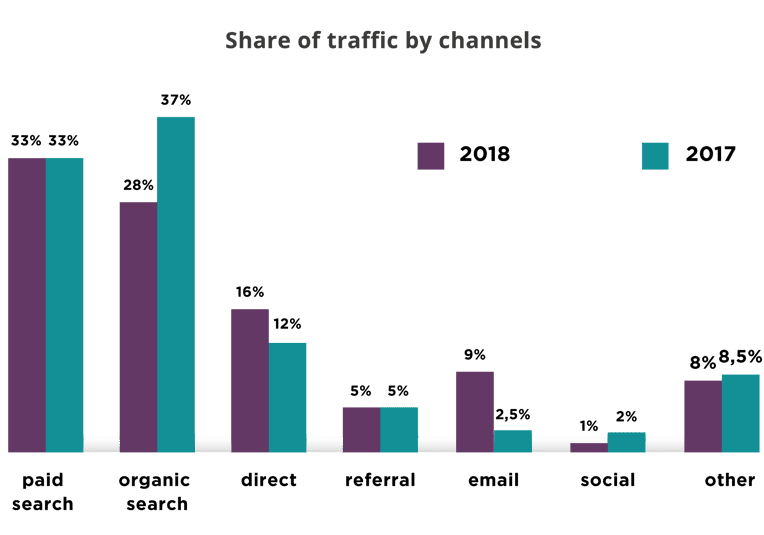
As for 2017, e-commerce websites received the most significant volume of traffic from organic search results (37%). This year, that was no longer the case, and paid results became the leader within traffic-generated channels surpassing organic by 1%.
Though, the picture with other channels is more curious. For example, email marketing led to sites by 6.5% more visitors in 2018. In turn, the number of users who came from social media networks dropped twice. Last year, traffic shares of these two channels were almost equal – 2% and 2.5%.
What does that mean for business?
Although the difference in paid and organic performance is fluctuating, these two are the most efficient traffic channels for online store sites, as customers got used to using Google to look for products. Investing in SEO and CPC (cost-per-click) ads must pay off next year.
Improve email marketing as well. Personalized trigger emails are better opened and “warm up” brand loyalty.
Display ads and social media are unprofitable
Organic search generated 27% of e-commerce revenue this year, which is the largest share within all channels. Paid search ranked second, producing a quarter of the e-commerce income. Compared to the previous year, referral traffic converted to revenue by 9% more, which can be explained by the increasing role of opinion leaders. Email marketing was successful not only in traffic generating; this channel brought twice more revenue from the last year.
The weakest performance in revenue-producing display ads and social networks demonstrated with 1% and 1% respectively.
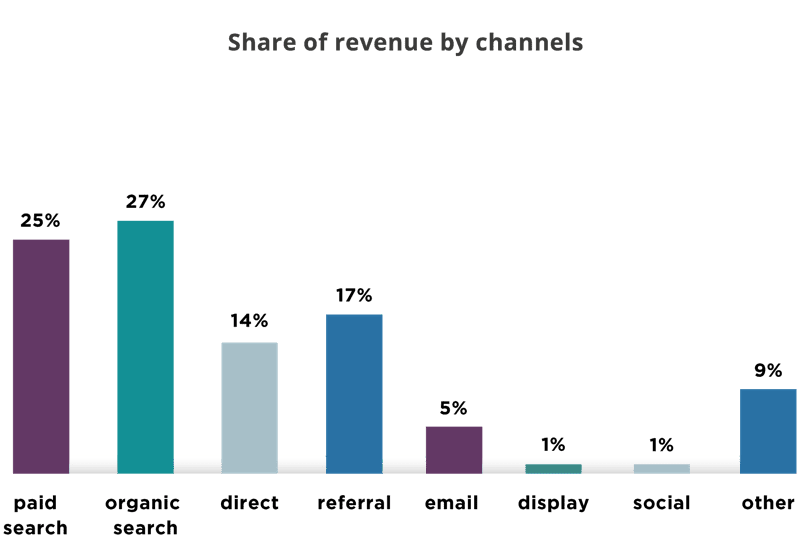
* hereinafter the last-click attribution model was used
What does that mean for business?
It may not be a surprise, but you still shouldn’t rely on display ads and social networks as the revenue-generated channels. These carry out another mission – enhancing brand credibility.
In turn, the moment to invest more effort in referral marketing has come. Try to contribute the information about your store for rating and review affiliate sites. You can also post info in online catalogs that your target audience may trust. Collaborate with price comparison shopping engines, cashback services and CPA networks to improve the link building strategy.
Monitoring your website with such services as Google Alerts will help you be aware of your brand references online as well as control these.
Email marketing is the king of conversions
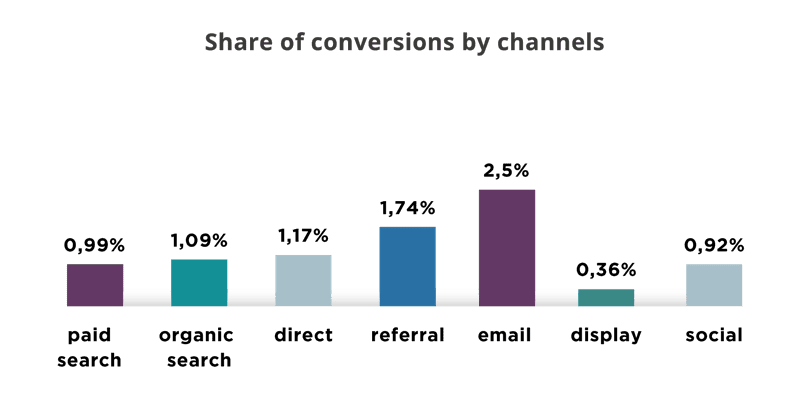
Over the last two years, emails have had the most significant conversion rate in e-commerce. This is most likely a result of the personalized approach brands are now using.
Holiday offers, notifications of discounts on products from a wish list, abandoned carts reminders and secret promo codes are used to intrigue users, as these are based on their interest and behavior. Moreover, this marketing channel, in general, interacts with an existing customer base.
In contrast, advertising in the paid search, which is the leader in traffic and revenue generating, has one of the lowest conversion rates as it mostly targets newcomers.
What does that mean for business?
Carefully creating goals for each ad campaign and channel can help you avoid unexpected results. You also need to ensure that your analytics are set up properly. For example, social networks or payment systems might sometimes be displayed within referral channels. This will help you allocate your marketing budget wisely.
Examine what keywords lead visitors to complete a target action to improve your semantics in further campaigns. Also, don’t forget about associated conversions as they can better estimate the performance of some channels.
Conclusion
The e-commerce market is constantly changing and adapting to customer behavior, demand and unstable search engines requirements. To stay profitable and make proper forecasts for coming years, you should keep tracking previous performance, locate pain points and improve these.
This year research revealed that traffic to e-stores has significantly increased by almost 100%. But along with that, transactions and revenue growth indicators are three times lower. This shows that following the omnichannel strategy and allowing your customers to buy your products both online and offline is the way forward.
Internet users aren’t fond of waiting until all your page sections are loaded and they are more likely to leave your site. Try to improve your website load speed to get closer to the market average – 6.7 seconds.
In 2018, mobile and desktop traffic shares were almost equal. At the same time, customers made twice as many purchases via PC. Besides the customer habit “search via phone and buy via computer,” you should analyze if your mobile version of the site is convenient enough for instant shopping.
It’s more beneficial to retain your existing customers than it is to try and attract new ones, as they generate four times more revenue. However, to draw newcomers, it’s better to use paid ads. Allocate appropriate goals for each marketing channel to optimize your promotion strategy.