Proving the effectiveness of content marketing can seem daunting. But if you can’t prove your worth to the c-suite, why would they keep investing in you and content marketing?
To prove your value to the c-suite, you need an easy, repeatable method for measuring how well your content marketing campaigns are performing, how they tie back to business objectives, and what you need to do next.
To prove your value to the c-suite, you need an easy, repeatable method for measuring how well your #contentmarketing campaigns are performing. Click To Tweet
It’s time for a content dashboard.
Dashboards have been around a long time. The goal of a dashboard is simple: to convey the most relevant information about something in one easy-to-understand place.
A content dashboard is no different. But how do you create a dashboard that proves the ROI of your content marketing efforts without getting lost in a sea of data? And how do you go the next step to create a content dashboard for you, so you know what you should create next?
Let’s start with a content dashboard for your c-suite (I’ll show you the free template there), and then we will dive into creating an actionable content dashboard for your content marketing team.
Create a content dashboard for your c-suite.
What are your business objectives?
The very first thing you need to do when creating a content marketing dashboard for your c-suite is to understand what your business objectives are for your content marketing program. These objectives should tie directly to your content marketing goals.
If your business objective is to increase leads by 10% YoY, and content marketing needs to drive half of that, then your content marketing goal is to increase leads 5% YoY.
If your business objective is to decrease calls to your customer support by 25%, and it’s 100% dependent on being achieved through a new online FAQ your content team is creating, then your content marketing goal is to decrease customer support calls by 25%.
Which content metrics matter?
You manifest what you measure.
Which metrics will show the success or failure of your content marketing goals? In the first example above, success or failure will be judged by total leads over time. In the second example, it will be necessary to get reports of total calls to the customer support team over time.
Identify the metrics that matter most. You don’t want to throw in metrics just to have them. Yes, it’s great that site traffic went up, but that doesn’t mean anything if it’s not part of your overall goal for content marketing. It creates clutter and takes away from the point of the content dashboard.
Some metrics may be easier than others to get. Leads, inbound traffic, e-commerce revenue, etc. may come from Google Analytics. Other metrics, such as call volume, may need to come from another source. Make sure you know how you’re getting your metrics and how often you need them (are you reporting monthly, quarterly, or yearly?) Remember, you’re only getting the metrics that matter the most.
How do those metrics translate to money?
When measuring ROI, you’re comparing money in to money out. So you need to understand how much money each of your goals is either making or saving the company.
In the example above, you can calculate the value of the average lead you get (total revenue from previous leads / total previous leads = revenue / lead). If you can go a step further and get the lifetime value of the clients brought in through leads, that’s even better!
For the call center, you should be able to calculate the cost savings per month of reducing call volumes by 25%. Someone must have that data, or else why would it be a business objective?
You also have to document how much money went out to achieve that goal. Here’s where you can pull in how much you spent on resources such as promotion, salaries, etc. Even a rough estimate will give you actionable data.
Assemble your data.
Now you put everything together. Pick a business objective/content marketing goal and the metric that measures it. That’s your first data point in the dashboard.
If you can get down to dollars and cents for each metric, add that as well (this will give you a true ROI figure).
Go through each of your main goals in your content marketing strategy, and have each accounted for in the content dashboard. Then, show the difference in how that metric has performed vs. the previous time period, and how it performed vs. your overall goal.
This is your c-suite dashboard. It shows them, in very real numbers, how their investment in content marketing is working.
Download the c-suite content dashboard template here
That’s great for them, what about you?
Create a content dashboard for your own team.
Proving that your content marketing efforts are working through a content dashboard is incredibly important, but the magic doesn’t have to stop there.
Producing great results that create a positive ROI is most of the battle. Content marketers need all the help they can get to create great content that resonates with their audiences and moves the needle in the right direction.
Proactive content dashboards can help content marketers understand what’s working, what’s not working, and where new opportunities may be hiding in plain sight. But the data that feeds these dashboards is different than the data that feeds c-suite dashboards.
The c-suite just wants to see what happened. As a content marketer, you also want to see what should happen next.
The c-suite wants to see what happened. As a content marketer, you also want to see what should happen next. Click To Tweet
The 5 key elements of a proactive content dashboard
A proactive content marketing dashboard will be more complex than the c-suite dashboard because it needs to not only show where you’ve been, but where you should go next. That’s going to involve new ways of looking at data and being able to drill into data to get more details.
A proactive #content marketing dashboard needs to not only show where you’ve been but where you should go next. Click To Tweet
1. The first key component to determining what to do next is to analyze what’s driving existing success. If leads are a key metric, you need to know what content and channels are driving those leads, so you don’t take your foot off the gas of the things that work.
2. You need to see where things might be changing. What content is rising quickly in both inbound sessions and conversions which are contributing to your success? This content could be ripe for more promotion, adding fuel to the fire.
3. Look at what content is dropping. Understand why it’s decreasing, and if it’s worth trying to save it, or if you should just let it drop and move on. If a top converting page is suddenly losing traffic, you definitely want to fix it. If a piece of content you promoted via email last week suddenly has fewer email visitors, it’s obviously not something to worry about.
4. Check out what pieces of content cover a topic that’s underutilized. Sometimes we stumble upon a topic people love, but for some reason or another, we don’t write about it again. Look for high performing content that is different than what you normally write about. You may uncover some great topics you never knew were so valuable to your audience (and you.)
5. Finally, look at your competitive space. This can be a bit tougher to do and goes outside of typical metrics you get from Google Analytics or other web analytics platforms. SEO tools like Moz allow you to set up campaigns and keep an eye on how well your competitors perform for a set of keywords that you’re also targeting. If a competitor suddenly shoots up in rankings for a keyword, you want to know. And you want to see what they did to make that happen (so you can do it even better).
To recap, the keys to a content dashboard that show you what to do next should include:
- The content that’s currently driving your goals
- What pieces of content are gaining the most traffic? Why?
- What pieces of content are losing the most traffic? Why?
- Look for underutilized topics that could be content opportunities.
- What’s working for my competition? How can I make their success my success?
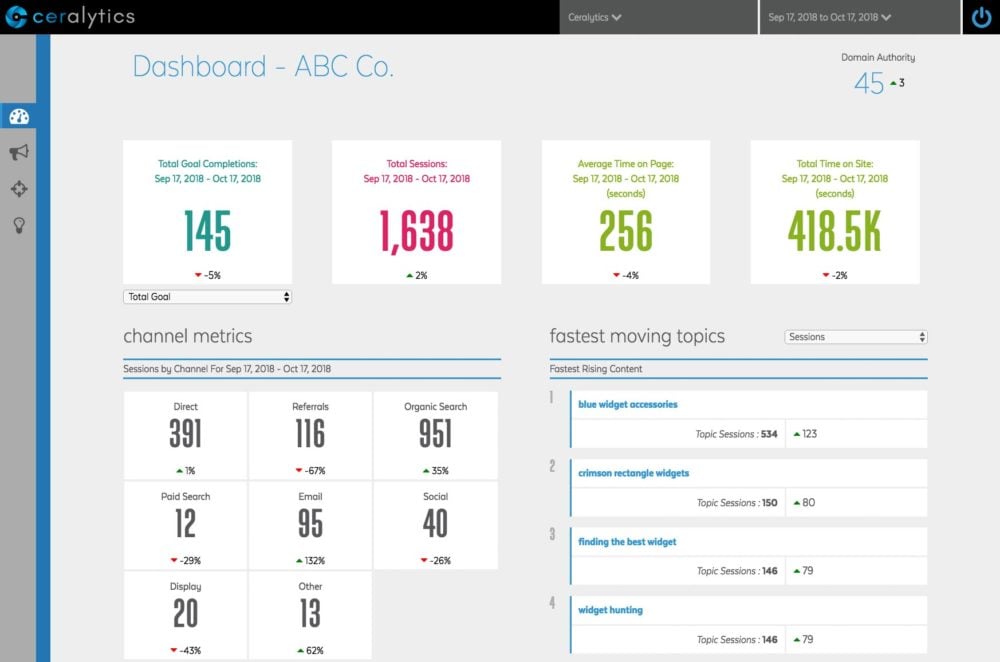
There are content marketing dashboards out there that help you get to this data already. Ceralytics provides a content dashboard and content intelligence to help you dig into what’s working, why it’s working, and what you should do next. It also breaks down websites into topics, making it easier to see which topics are driving the most traffic and conversions on your site.

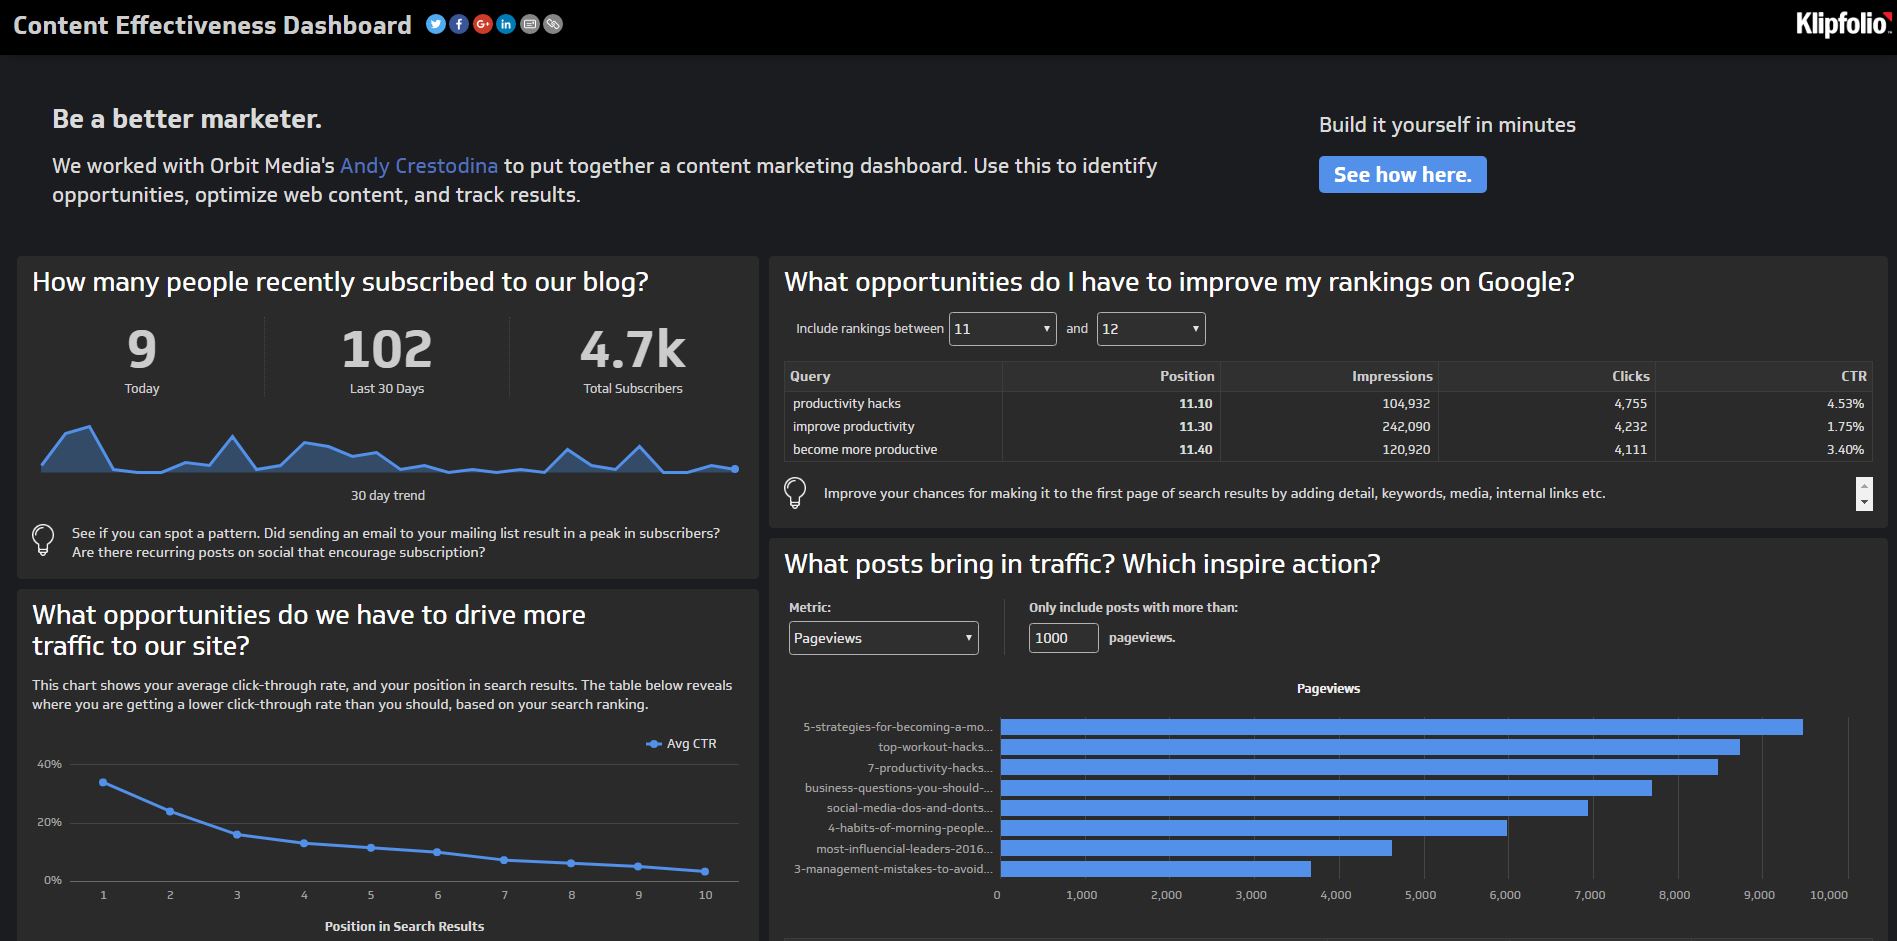
Klipfolio has a great start on a content dashboard as well, which can be customized with more of the data discussed previously. This data comes almost exclusively from Google Analytics, but provides more flexibility than Google Analytic’s Dashboard.

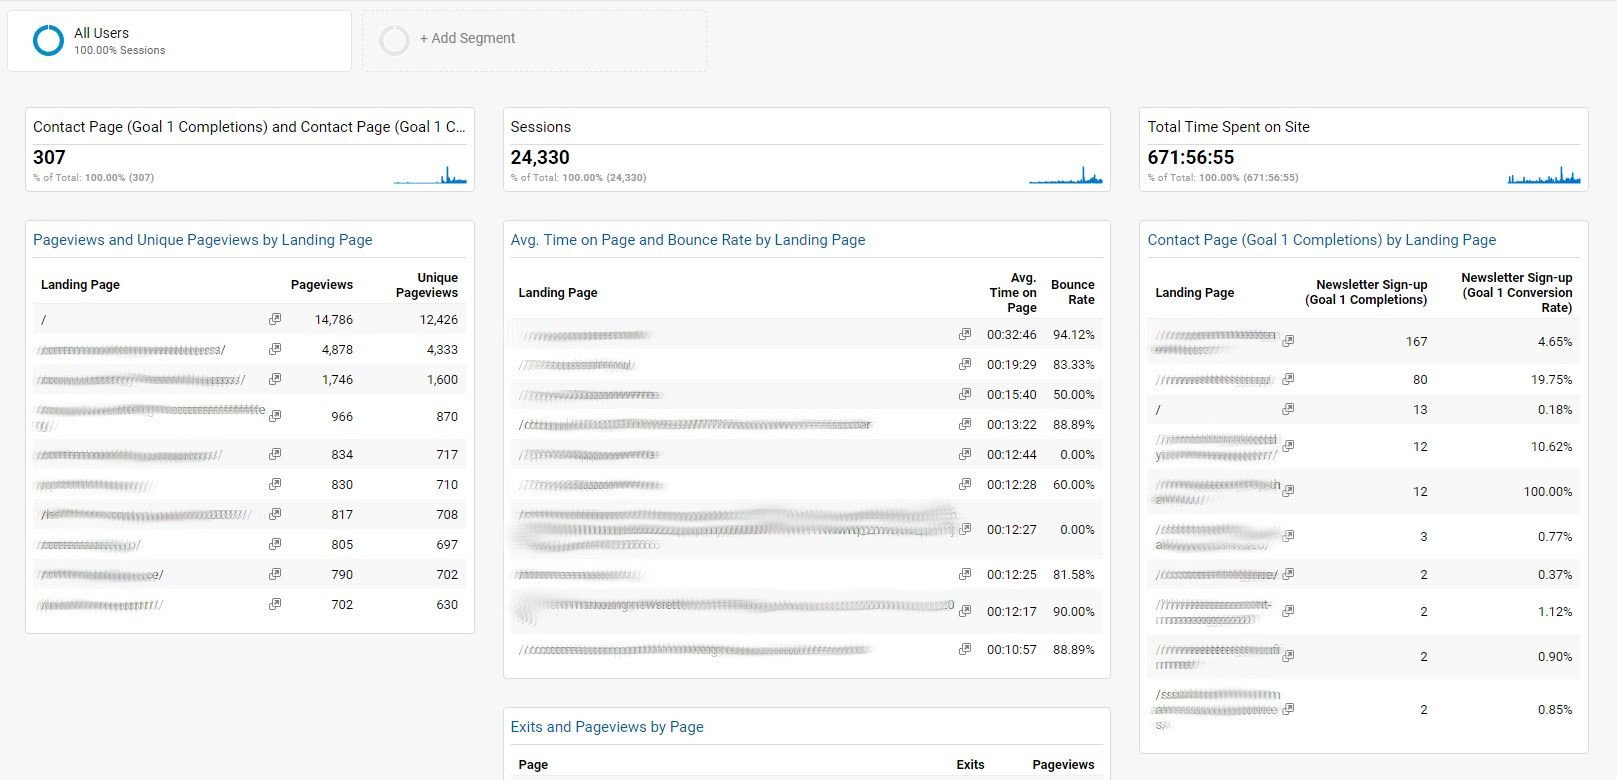
Google Analytics gives you the ability to create custom dashboards of data, so you can pick and choose the data that makes the most sense for your content campaigns. Here’s a Google Analytics template you can use to get started. Update your goals and clone the goals section for as many goals as you want to track.

Unfortunately, Google Analytics doesn’t have all of the answers, but this is at least a start — and it’s free!
There’s no one size fits all dashboard.
Your perfect dashboard will need to be customized to your individual business objectives, and it may never actually be perfect. But with the tools above, it will be something very useful for proving your value to your c-suite and driving better results for your content team.