You need better content marketing metrics – ones that your executive team really care about
Like the father character Tevye in the classic movie ‘Fiddler on the Roof,’ some digital marketers seem to blindly follow tradition without much thought. They focus on traditional metrics like click-through rates, cost per acquisition (CPA) or return on ad spend (ROAS). The problem is, their executive leadership often doesn’t see how these metrics translate to the bottom line.
Keeping in mind the goal of marketing: to grow your business at the lowest possible cost. So, for brands whose growth depends on acquiring and nurturing leads, your content marketing (CM) metrics must align with that goal. Every activity you do, campaign you execute, or A/B test you run, needs to produce a solid return on your marketing time and tools investment – that is, generate a positive return on investment (ROI).
I’ll get into these ROI calculations in a minute. But first I’ll cover some content marketing measurement basics.
Content Marketing (CM) measurement basics
There are three aspects of any metrics you measure:
- Deciding what to track
- Measuring and managing the data
- Turning the data into actionable insights
Let me walk through each of these in detail.
Deciding what to track
Just because you can measure something, doesn’t mean that you should. So it’s best to start by first:
- Identifying your top measurement priorities, and the underlying metric data you need to support these priorities.
- Establishing performance benchmarks for your analyses.
- Calculating the baseline costs involved in executing your content plan, so that you can ultimately calculate a return on this investment.
Specifically, you need to decide which key performance indicators (KPIs) to track as evidence of your content’s impact. You also need to make sure that the visitor actions that relate to each of these metrics are ‘tagged’ in your analytics tool. If you haven’t tagged it, you can’t track it.
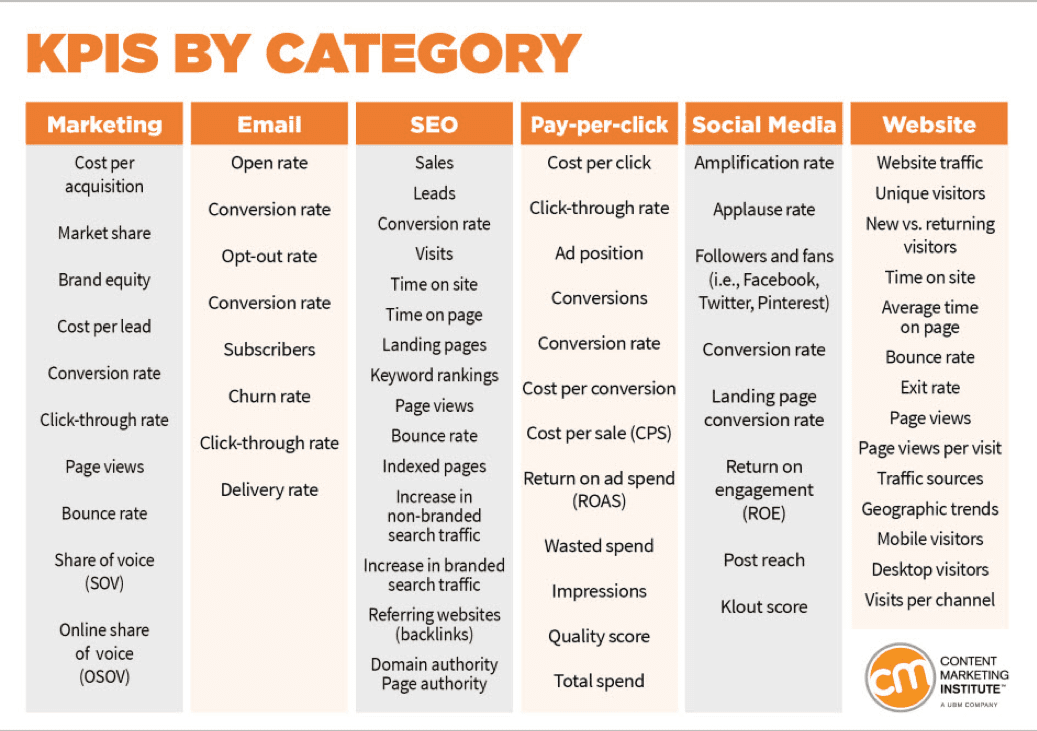
The graphic below shows the most common KPIs for each category of content.

Note that the vast majority of these KPIs (with the exception of Conversion Rate, Conversions and Sales) are simply indicators of performance, but not directly tied to revenues.
So you shouldn’t track all of these metrics just for the heck of it. Instead, you should seek to:
- Discover which of the above KPIs have a high ‘conversion or revenue leverage’ (correlate with higher downstream conversions).
- Track and analyze the data that allow you to calculate the revenues generated and costs incurred for each of your campaigns (because these will feed your ROI calculations).
Measuring and managing data
As you’re putting your measurement program in place, decide how frequently to collect data. Collect too often and you may not allow enough time for patterns to appear. But wait too long and you risk overlooking problems that could prevent your content from reaching its goals.
Cathy McPhillips of the Content Marketing Institute recommends tracking performance on a monthly basis initially, then adjusting your timeline later, if necessary.
Once you’ve chosen the metrics that are most meaningful for your business, you’ll want to track the performance of every content asset you publish against those benchmarks. Building dashboards is the best way to do this since you can see all your data in one place whenever you want.
If you’re looking for automated help here, technology journalist and consultant Jeremy Cook provides a comprehensive list of 45 content tools for creating, curating and measuring your content marketing efforts.
Turning data into actionable insights
Google Analytics (GA) has become the defacto place to start reviewing site visitor metrics like page views and bounce rates. But these aggregated data only give you the ‘big picture’ of your content’s performance. To learn why certain content is yielding better results, you’ll need to measure the impact of your marketing on an individual level. This is the realm of marketing automation and CRM systems.
By integrating the latest generation of marketing automation apps into your marketing tech stack, you can track which content your prospects consume. Then, by correlating this content with the actions your visitors took before and after viewing it, you can discover which content pieces are most likely to result in a conversion.
You can dig deeper into these more sophisticated marketing technologies, including AI-based personalization platforms, in this Smart Insights guide.

ROI: The metric that grabs your exec team’s attention
The other KPIs are nice, but let’s face it, the metric your executive team (especially your CFO) most cares about is the ROI of your marketing team’s efforts.
To calculate the ROI, you’ll first need to estimate the baseline costs involved in creating, distributing and promoting content in your organization. You’ll need to factor in both average production costs — such as copywriting, design services, and marketing tools and technology — as well as team overhead and administrative costs.
A more straightforward way to demonstrate business value is by calculating the return on investment of each campaign. Rather than factoring in your business’ overall cost of delivery, simply calculate Marketing Dollars In (expenses) and Marketing Dollars Out (revenues). Then calculate your per-campaign ROI as:
ROI = (Revenue – Expenses) / Expenses
After you’ve done this for each of your marketing campaigns, consolidate the revenue and expense amounts across all channels to get your overall marketing ROI.
As your CM program gets more sophisticated — or after you add data scientists to your team — you can always build more rigor into your ROI calculations.
The folks at Express Writers, an agency that writes content for hundreds of clients who outsource their CM efforts, created an infographic that shows several sample ROI scenarios and calculations.
The article itself is a great example of ‘evergreen’ content — content that doesn’t become outdated over time. Your CM efforts should definitely include creating content that, over time, populates the ‘trunk’ and ‘branches’ of your content marketing ‘tree.’
Calculating the value of your leads
Some content marketers, as they coordinate with their sales teams, talk more in terms of leads, and the value of these leads. If this sounds like you, here’s how to calculate the revenue value of leads, which you can then feed into the above ROI calculation.
First, a couple of definitions:
- A SQL is a prospective customer who has been researched and vetted, first by an organization’s marketing department and then by its sales team. These leads fit your target buyer persona and have the means (budget) to buy.
- Most marketers actually have many more marketing-qualified leads (MQLs). An MQL is a website visitor whose engagement levels indicated that they are likely to become a customer. It’s the marketing team’s job to nurture this lead so that it becomes a SQL.
Let’s say you sell cloud-based CRM software and your marketing efforts have generated 500 SQLs for a given month. Each of these leads, if converted, represents $1200 (the average lifetime value, or LTV, of each customer). Historically, you only convert 4% of these SQLs into paying customers.
So, in our example, the revenue value of all leads is:
$1200 x 500 x 0.04 = $24,000
Or $48 per SQL.
Simply insert this value into the above equation, along with an estimate of your cost of acquiring these customers, to get your ROI.
The ROI of video marketing
If you’re doing video marketing (and you should be, because, in my experience, well-produced videos generate higher returns than copy-based content), the calculations are similar.
Video marketing ROI: a simple calculation
The most common and simplest way to calculate ROI for videos is to take the revenue generated by your video campaign and divide it by total video production costs. For example, if you acquired 50 paying customers worth $50 each, and the video cost $600 to make, you’d have an ROI of ($2,500 – $600) / $600 = 3.17.
This metric is a quick and easy way to compare the effectiveness of different video campaigns. If one video has a higher ROI than others, it would make sense for you to ramp up the traffic to the higher-performing video (and its associated lead-generation funnel).
Video marketing ROI: advanced calculation
A more sophisticated way of analyzing video performance is using lifetime value (LTV). This requires the following data points to calculate churn rate and average revenue per user. You can track LTV and measure how it changes over time for each video campaign. This analysis is really useful since it informs how you should allocate your marketing spend for future campaigns.
To calculate LTV for a given video campaign, divide your average revenue per visitor (ARPV) by your customer churn rate (the percentage of customers who leave you each year). That is,
LTV = ARPV / Churn Rate
For example, if your ARPV is $30, and your churn rate is 2.5%, then the LTV = $30 /
0.025 = $1200.
To calculate the ROI, subtract the cost of acquisition from LTV, and then divide by the cost of acquisition. Using the cost of $600 from earlier, the ROI based on LTV would be:
($1200 – $600) / $600 = 1.0.
In other words, this video campaign just broke even.
The previous example assumes that you only acquired one customer. If you acquire more than one, divide total costs by the number of customers acquired and see how that boosts your ROI. For instance, if you acquired five customers, the ROI would be ($800 – $120) / $120 = 5.67.
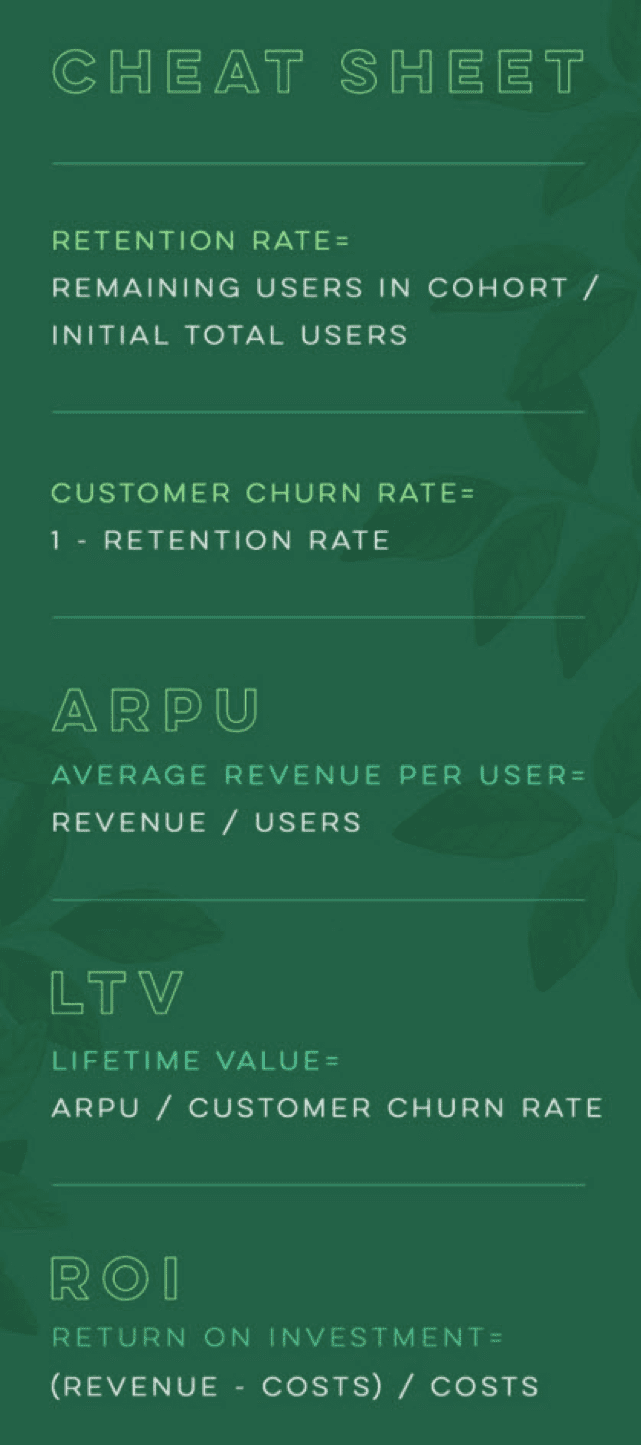
Video hosting and analytics vendor SproutVideo provides a handy ‘cheat sheet’ reference for these calculations.

ROI Calculator
If you have the revenue and cost (investment) for each campaign or aggregate values, you can plug them into Calculator.net’s ROI calculator. I hope you’re not annoyed that I shared this with you later versus sooner – I’m a firm believer that you first need to understand how the calculations are done before automating them.
Time to break with tradition
If you’ve noticed that the metrics you’ve used for years to measure the performance of your content marketing don’t measure real revenue gains, or capture the attention of your executive team, it may be time to break from tradition.
Return on investment (ROI) is what your company’s C-level executives care most about. So it behooves you to learn these calculations and, just as importantly, the tagging and data analysis you need to enable so you can present these ROIs (and their source data) in the most straightforward way. By sharing your high ROIs, you may make the case for investing more in the marketing tools and technologies that will convert more of your leads into customers.
