April 5, 2018
Do you ever wish you could take a formula that you use in Excel, and plop it directly into your ad interface? If so, I’ve got some good news for you friend! Today we’ll be talking about formula columns available in DoubleClick Search.
To start off we’ll learn what formula columns are and how they work, then we’ll go through a few use cases that will serve as good examples.
Set Up
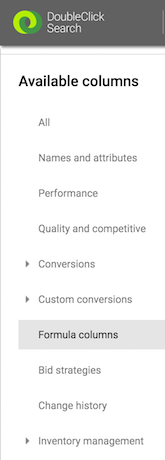
Setting up a formula column is easy as pie. Within the interface, click the Columns button, and then navigate to “Formula columns” on the left side.


Upon clicking “+ NEW COLUMN” a window will pop up for you to name your column and enter the formula.
For a list of available formulas, you can search in this handy table. The syntax of the formulas is very similar to Excel, just make sure you use the correct parenthesis and quotes as needed.
Renaming Columns
Say you want your Conversions column to be named “Leads”. No problem! Go ahead and create a new formula column with the name you’d like.
Custom Metrics
The example given on the DoubleClick support site is using actions per cost (or conversions per cost) vs. cost per conversion.
Alerts / If Statements
This is an excellent way to incorporate some custom rules and alerts directly in the interface.
Example: if average daily impressions is below ten, mark these as “low run rate”.
=if(Impr / Num_days() < 10, “Very low run rate”, “”)
Example: Label campaigns that have spent over 90% of the daily budget for today.
=if(Cost.For_Date_Range(today()) >= .9*Daily_Budget, “Over 90% Spent today”, “—” )
Date handling
This is a great use for formula columns. In this example, you can pull the average daily spend for the last 7 days:
=Cost.For_date_range(Last_7_days())/7
Alternatively, let’s calculate the average weekly spend over the last 6 weeks:
In this formula, we need to pull the last 7 week spend, but subtract the spend from this week. Then we divide by 6 to get the average weekly spend. Voila!
=(Cost.for_date_range(from_date(),calendar_weeks(-6, 2)) – Cost.for_date_range(from_date(),calendar_weeks(0, 2)))/6
Applying the Formula
When you’re setting up your formula, DoubleClick gives you the option to apply the formula before totaling data or after. From the support site:
- Before totaling data: applies the formula to each summary row and then the results are totaled.
For example, for a formula column that divides keyword cost by the number of days in a report, this option divides the keyword’s cost by the number of days in each summary row and then adds up the results.
This option also enables executive reports to include data across multiple advertisers. That is, if an executive report is scoped to multiple advertisers and you add a formula column to a chart or table, the chart or table will apply the formula to each row and then sum the data from all advertisers in the report’s scope.
- After totaling data: sums the raw data in the individual rows and then applies the formula to the sum.
For example, for a formula column that divides keyword cost by the number of days in a report, this option sums the total cost first and then divides the total by the number of days.
Wrapping Up
If you’re currently using DoubleClick to manage your campaigns, Formula columns are a fun addition to make your reporting and optimization easier. Once you get used to the syntax of the formulas, the rest is easy. What do you think, PPC Heroes? Do you use custom formulas? Let us know @ppchero!