Chart of the Week: 42% of email senders have a good reputation score but is that enough to get emails into inboxes?
Email marketing can help convert leads into customers, re-engage existing customers and provide a high level of ROI – if you get your campaign right. Your emails aren’t just about engaging images or CTAs being in the right place, first and foremost, your campaign needs to be about getting emails into inboxes, which is where many people fail.
According to Return Path’s 2019 Sender Score Benchmark Report, 2018 saw more than 600 billion emails sent by spammers, which ultimately means that email providers get stricter with protocols designed to stop spammers. While these protocols are meant to protect people from potentially harmful emails, legitimate senders can be affected.
In an attempt to ensure that “good” email senders get through to inboxes rather than being marked as spam, mailbox providers judge the sender’s reputation. This reputation is based in a number of metrics, which change for each provider, meaning that senders need to ensure they boost their reputation to avoid ending up in the spam folder.
Email senders’ reputation is defined within Return Path’s report as a Sender Score, based on similar metrics to mailbox providers’ reputation scores, and is marked between zero and 100.
Who is sending emails?
According to the benchmark report, overall email sender reputation has seen a marked improvement since the initial report in 2012. Whereas back then, 60% of emails were sent from sites with a Sender Score of under 11, just 16% fell under this score in 2018.
While this improvement is likely due to many spammers and black hat tactics being taken down, it also suggests that marketers are more aware of the importance of reputation when it comes to their email campaigns.
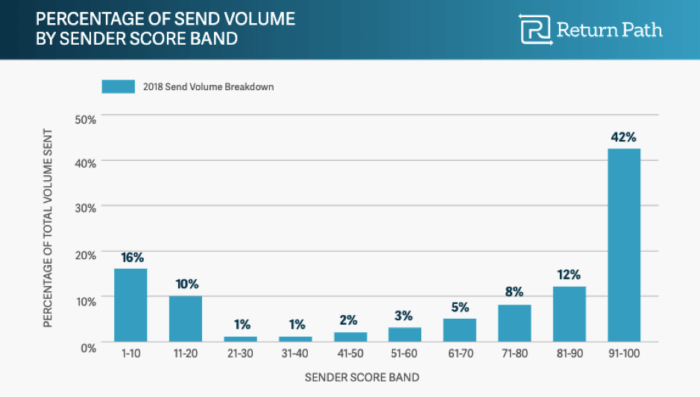
There is now a large number of senders (42%) with a reputation marked as being between 91 and 100, which will ensure their emails are seen in the inboxes of the vast majority of recipients. In fact, 70% of senders have a Sender Score above 50, showing that there is a lot of competition to get emails seen once they land in inboxes.
How is sender reputation affected?
Every mailbox provider uses its own metrics to decide email senders’ reputation, but many of these are generally the same. This means marketers can assess whether they are likely to be marked as spam or not. Three common factors in terms of email sender reputation are complaint rate, unknown user rate, and spam trap count.
Complaints
If a user marks an email as spam or junk, it generates a complaint. A large number of complaints generated by a sender can reduce their reputation and Sender Score. Marking emails as spam also helps mailboxes identify similar messages in the future, improving their spam filters.
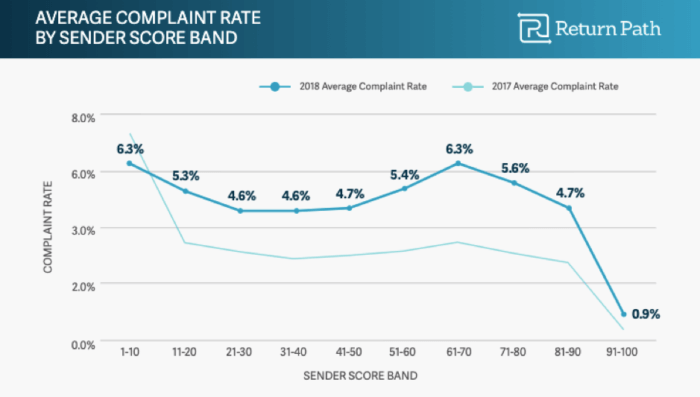
Looking at last year’s results, email senders with a Sender Score of between 9a and 100 were the only ones with a complaint score of less than 1%, coming in at 0.9%. In comparison, there is a sharp increase for those with a score of between 81 and 90, with an average complaint rate of 4.7%.
Unsurprisingly, those with a score of between one and 10 had a high average complaint rate of 6.3%. However, the 61 to 70 score band saw the same complaint rate, suggesting that marketers within this score band need to assess exactly what about their messages may be getting them marked as spam by recipients.
Unknown users
Unknown users are reported when an email bounces due to the email address not existing at the receiving mailbox provider. In this instance, a hard bounce code is returned so senders can remove them from their mailing lists. Failure to do this and sending to a high number of unknown users can mean that email senders are marked as suspicious, reducing their reputation.
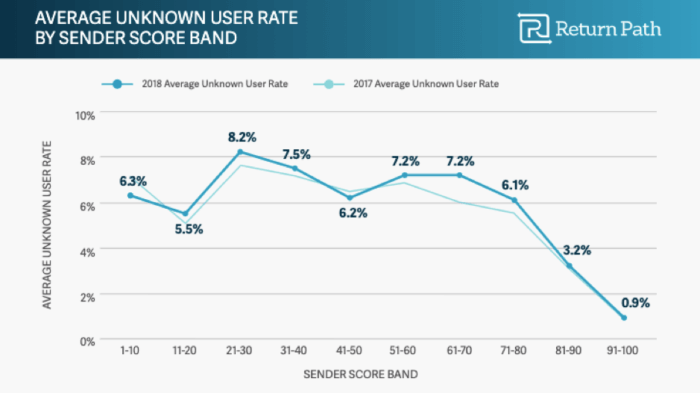
Unsurprisingly, those with a high Sender Score saw fairly low average unknown user rates, with those scored between 81 and 90 at 3.2% and those between 91 and 100 seeing an average of 0.9%.
What might surprise you is the fact that the highest rate was not seen by those with a Sender Score between one and 10. Instead, the highest score of 8.2% belonged to those scoring between 21 and 30, which increased compared to 2017.
Delivered rate
As the name suggests, this metric measured how many emails were successfully delivered without being bounced. While it doesn’t show whether the email was delivered to the inbox or spam folder, it does take into account emails that are unlikely to be seen by the recipient.
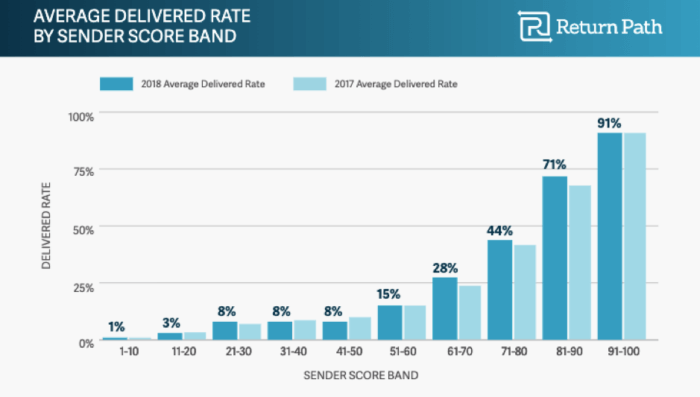
The expectation is that those with a high Sender Score have a high delivery rate, which is the case. Those scored between 91 and 100 have a 91% average delivered rate, matching 2017’s rate exactly.
As the above graph shows, when Sender Scores get lower, so too does the email delivery rate. The lowest is just 1%, which is seen by those with a Sender Score of between one and 10.
Those with Sender Scores between 61 and 90 all saw improvements in their average delivered rate in 2018 compared to 2017, suggesting that they are making improvements to their email marketing strategy.
Inbox placement
One emails make past these filters, there are more for them to get past in order to decide which folder they will be delivered to. This can take into account reputation but also engagement levels, with filters being different for each mailbox provider.
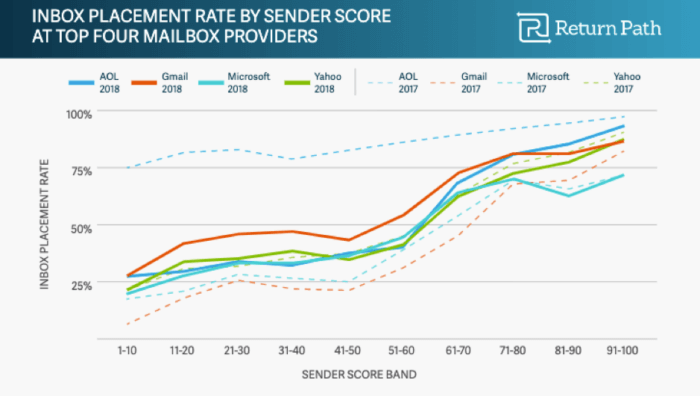
Just as you’d expect to see, inbox placement for the four largest mailbox providers improves as Sender Score increases, meaning a good reputation is likely to mean your emails land in people’s inboxes rather than being sent to another folder with a lower chance of being opened.
It is worth noting that the graph shows that AOL’s inbox placement rate dramatically declined in 2018 compared to 2017, suggesting that the provider has updated its filters to bring it more in-line with other providers. This means that email marketers likely saw a drop in open rates for emails sent to this provider.
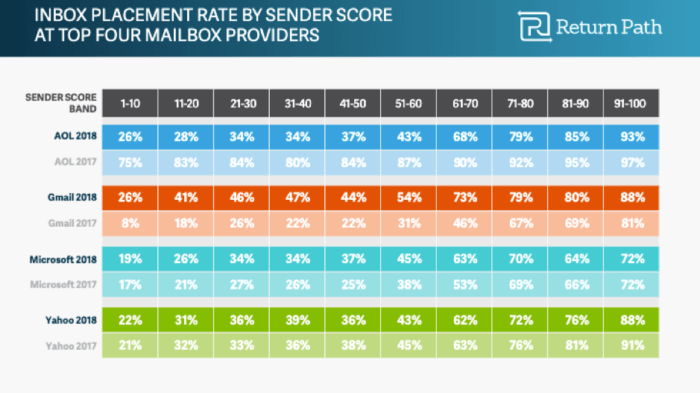
In fact, only Gmail saw the inbox placement rate increase across the board for 2018 compared to 2017. Comparatively, Yahoo and Microsoft saw mixed results – with both seeing those with top Sender Scores achieving lower inbox placement rates – while AOL was down across all Sender Scores.
This shows that a high Sender Score doesn’t automatically mean that an email sender will see a high inbox placement rate. There is a lot that needs to be taken into account – such as recipient engagement and mailbox provider filters – beyond the reputation of the sender.
Final thoughts
While the report only gives a fairly basic view of the effect that reputation has on email marketing, it does show that this is still an important factor that marketers need to take into account. Failing to follow email best practice – such as clearing out your subscriber list – can mean your reputation falls, affecting the ROI you get from your efforts.
Ensuring you’re using white hat tactics within your email marketing to get messages into inboxes, as well as making sure all emails are as engaging as possible, will help your reputation improve while also ticking boxes when it comes to filters set by mailbox providers.

