$(‘#scheader .sc-logo’).append(‘ ‘);
$(‘#scheader’).append(”);
$(‘#scheader .scdetails’).append(‘
‘+cat_head_params.sponsor+’
‘);
$(‘#scheader .scdetails’).append(cat_head_params.sponsor_text);
$(‘#scheader’).append(‘
ADVERTISEMENT
‘);
if(“undefined”!=typeof __gaTracker){
$(‘#scheader a’).click(function(){
__gaTracker( “send”,”event”, “Sponsored Category Click Var 1”, “paid-search”, ( $(this).attr(‘href’) ) );
});
}
}
});
});
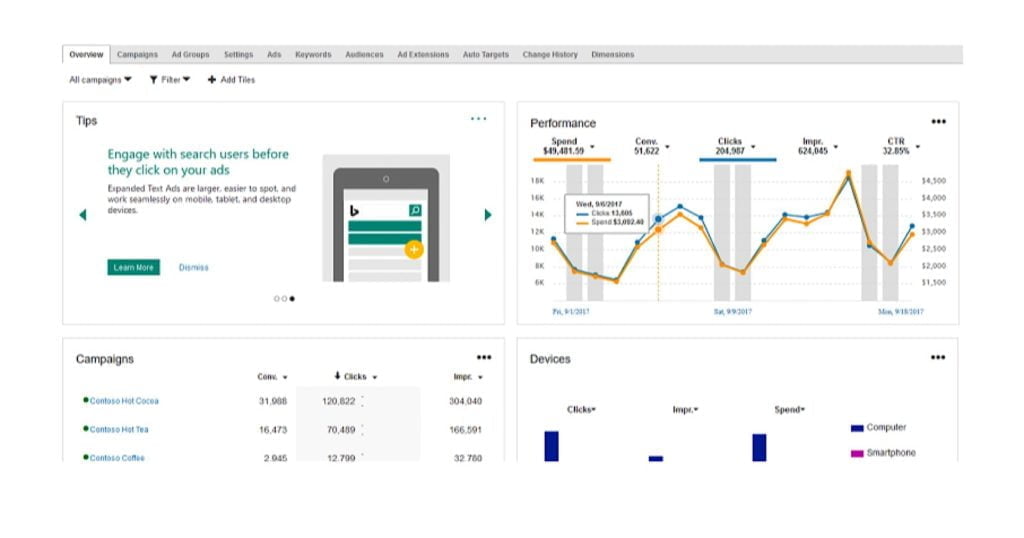
Bing Ads has introduced a new overview tab that provides a big picture view of account performance.
The overview tab can be found on the top of any campaigns page. Data segments included in the new overview tab can be customized to focus on the key insights you care about.
Data within the overview tab can be modified to contain segments that aren’t there by default, such as performance by campaign and performance by device.
As a supplement to campaign performance data, the overview tab will also contain a ‘tips’ section highlighting new features that are relevant to your business.
Advertisers will see familiar filters, such as data from a specific time period, period-over-period comparisons, and the ability to add custom filters.

Segments of data in the overview tab are called “tiles,” and tiles can be added or removed based on personal preference. Tiles can also be rearranged if you’d like to see them appear in a different order.
Bing Ads’ overview tab will be rolling out to all advertisers over the coming weeks.
