You can’t improve something if you don’t know that it needs to be improved. That was very true for us four years ago when we first started looking into equal pay at Buffer.
We have long used a salary formula to determine all of our salaries – the same role in the same part of the world receives the same salary. That means our adjusted pay gap is nonexistent.
At the time, we hadn’t been looking into our unadjusted pay gap. This number compares earnings between everyone at a company, regardless of their position, experience level, or type of work.
In the last four years, we’ve committed to measuring and sharing this gap transparently as we work toward closing it.
Before we dive into our most recent analysis, I want to go over a few popular equal pay terms.
Terms
Equal Pay Day
When we say this, we are talking about Equal Pay Day in the U.S., which represents all women and all men. There are Equal Pay Days in other countries and for specific groups of people. We’ve chosen this one as it includes all of the women at Buffer.
Gender pay gap
The gender pay gap or gender wage gap is the average difference between the remuneration for men and women who are working. There are two distinct numbers regarding the pay gap: non-adjusted versus adjusted pay gap.
Adjusted gender pay gap
This is the earning gap between people who perform similar roles. For example, if you have two social media marketers, are they making the same amount of money? We have no adjusted pay gap at Buffer because we use a salary formula for all of our salaries.
Unadjusted gender pay gap
The unadjusted number compares earnings between all men and women make at a company, regardless of their position, experience level, or type of work. This is the pay gap we are talking about in this report.
Our 2020 Equal Pay Data
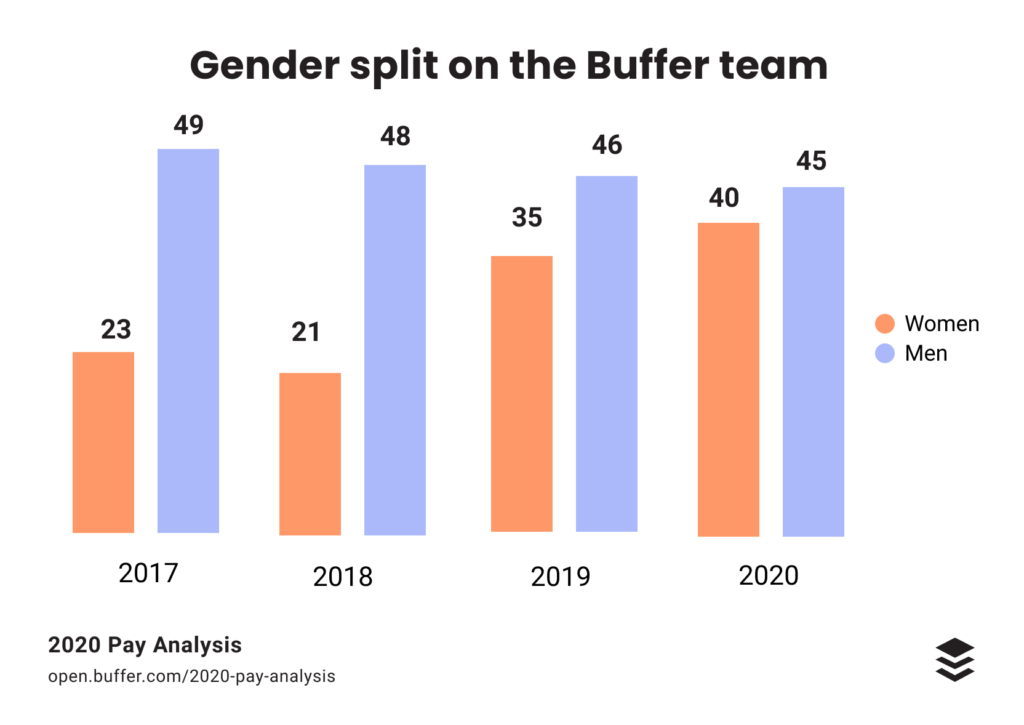
Here’s what the unadjusted gender pay gap looks like at Buffer as of March 2020. At the time of this analysis, we have 85 people on our team – 45 men and 40 women.
Average
Women: $112,745
Men: $126,855
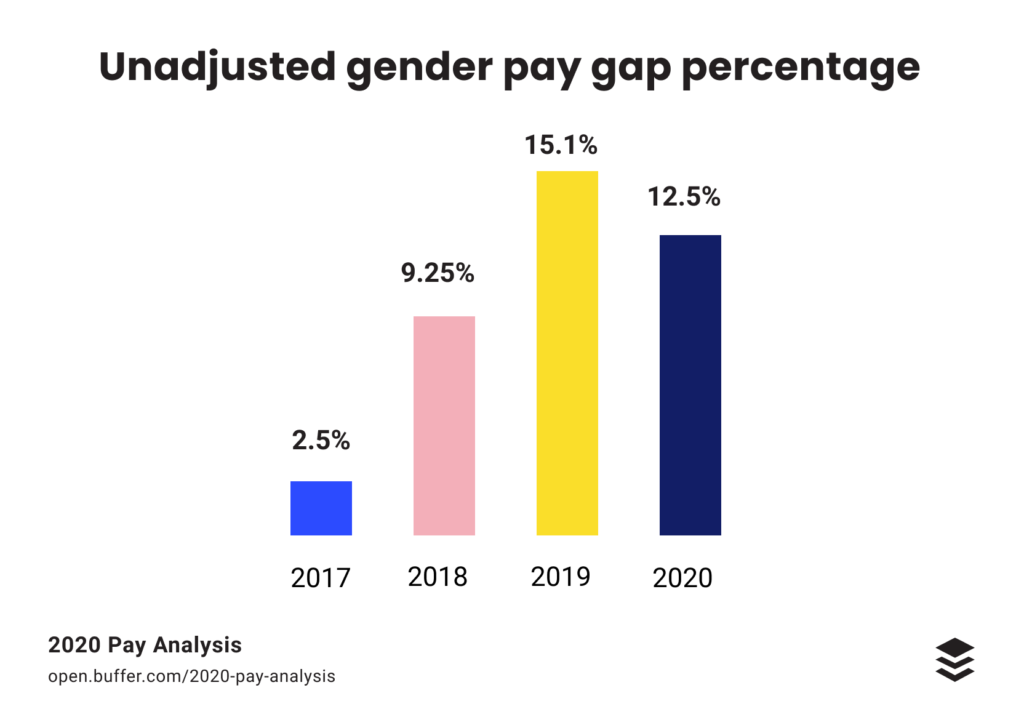
Unadjusted percentage gap in March 2020: 12.5%
Diving into the numbers
This year is the first time our pay gap percentage has gone down since we’ve been reporting it, and we’re pleased to see some progress. Our reports from 2019, 2018, and 2017 all have a lot more information. We’ve seen this percentage change a lot over the years because we’re a smaller team so hiring and departures often impact us quite a bit.
Here’s how this year compares to our previous years:
Another significant change for us this year is that with 40 women and 45 men, we are getting much closer to having gender equity on the team. Since 2018, we’ve nearly doubled the number of women at Buffer.

As you can see from the percentage chart above, in the last few reports, we’ve seen massive changes year over year. We’ve found it’s often hard to get a full picture when so much has changed in a year. So we’ve started measuring our equal pay number month over month, instead of only looking checking it once a year.
We already feel like we know a lot more than in previous years because of this change. It helps us get a full picture of how changes on the team impact this number.
Between August 2019 (when we first started tracking this monthly) and March 2020, you can see that our percentage gap was anywhere between 10.88% to 12.62% depending on personnel changes like new teammates joining, teammates leaving, and promotions.

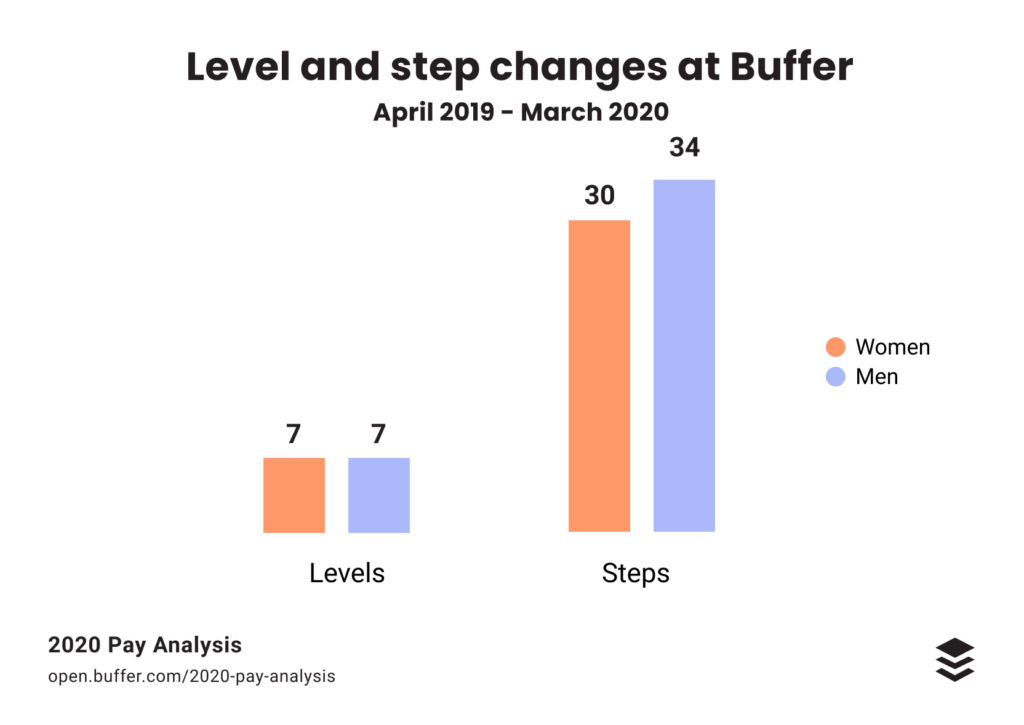
Taking a look at the data from promotions this last year (April 2019 – March 2020), we can also see that they have been relatively even.

Levels are more traditional promotions to the next experience level. Steps are smaller ways to be recognized within each level; there are four steps in every level. For more about our career framework at Buffer, check out our blog post.
What we’re focused on for equal pay
We’re happy to see this percentage gap starting to go down, and we’re going to keep working on things that are working. Things like:
Diversity in our hiring. When we recruit, we make sure to get our job openings in front of a diverse pool of candidates through organizations like Tech Ladies, Power to Fly, and Ada’s List. We also write job descriptions that are clear and only include what’s necessary. Women are more likely to apply for jobs or promotions only when they can be sure they hit 100% of the criteria, while men tend to be okay with 60% or so. We now add disclaimers that say, “Even if you’re not sure if you fill all these criteria, please apply anyway!”
Transparency. We’ve had transparent salaries since 2013. We also have a transparent salary formula and a transparent career framework. It’s hard to know if your salary is equal if you don’t understand how what you make compares to others. We’ll continue to be transparent as an organization with pay not only for our teammates but also for anyone else that wants to use that information to help their salary research.
Family leave. We offer (and strongly encourage!) the same amount of family leave for all genders to normalize leave and combat “unconscious bias” against women and mothers in the workplace. Much research shows that the birth of a child is when the gender wage gap grows.
We’re committed to continuing to share our equal pay journey every year. This is our fourth equal pay report, check out reports from 2019, 2018, and 2017.
If you have a question about our data that we didn’t answer, leave a comment below, and we’ll get back to you!
To get in touch about publishing this data, please email [email protected].
