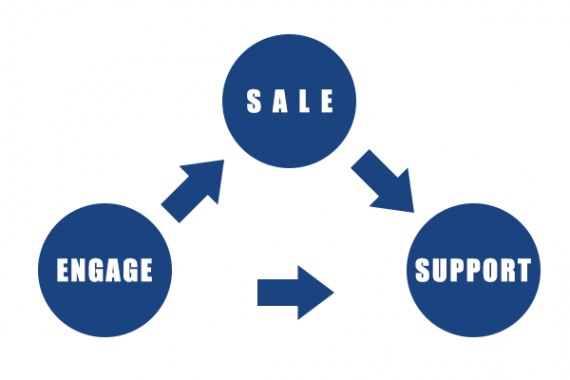
Good digital marketing campaigns create virtuous sales cycles, repeatedly engaging, converting, and supporting customers and prospects. Increase performance anywhere in the cycle and more sales should follow.
Virtuous sales cycles in ecommerce tend to create a relationship with the shopper. The cycle begins when you make a sale. It continues as you support the customer after the sale, and engage the customer in, say, a post-purchase email series. That could lead to helpful content or a beneficial offer, which could produce an additional sale, support after that sale, and re-engagement.

For ecommerce, a virtuous sales cycle begins with a sale, then support after the sale, and ultimately engages the customer with interesting content or an offer. The engagement leads to a new sale, and repeating the cycle.
Email marketing — particularly automated email marketing — plays an important role in this cycle. It deserves a significant amount of our attention. Three key performance indicators can work together to help improve most aspects of email design, content, and continuity. In the context of a virtuous sale cycle, these improvements should lead to more sales.
These three email KPIs will probably be familiar to you. But after the brief definition of each, consider what these tell you about your email message’s success.
Open Rate
The open rate measures the number of recipients who opened and viewed a particular email message.
To calculate the open rate, divide the total number of unique opens by the total number of emails sent. The result is expressed as a percentage.
If an online retailer sent 10,000 email messages as part of a campaign and 850 of those messages were opened, the campaign would have an 8.5 percent open rate.
(850 ÷ 10,000) × 100% = 8.5%
Multiple factors can influence an open rate.
- Subject line. A good open rate may indicate an interesting and relevant subject line, while a poor open rate may indicate the opposite.
- Email segmentation. A properly segmented email list should produce a relatively higher open rate. Narrow your focus to broaden your appeal.
- Email frequency. Send too many or too few email messages to your list and there may be a corresponding decline in open rates. Find the right frequency.
- Brand recognition. An open rate may also be a reflection of how well the recipient recognizes your company’s brand.
Email service provider MailChimp reported an average open rate of 16.75 percent for the ecommerce industry, based on data from February 1, 2017.
To improve open rates, use A/B or multivariate tests for your subject lines, segments, and frequency. Increasing brand recognition is a relatively slower process that has more to do with other areas of your marketing.
Click-through Rate
The click-through rate is a strong indication of whether or not your subscribers found your email content relevant or useful.
The formula for the click-through rate varies, unfortunately. It is sometimes confused with the next KPI on this list, the click-to-open rate. Perhaps the most used click-through rate is to divide the number of unique clicks (not counting when someone clicks two links in a single message) by the total number of emails sent — expressed as a percentage.
With this formula, if a marketer sent 1,000 emails and collectively those emails received 23 unique clicks, the click-through rate would be 2.3 percent.
(23 ÷ 1,000) × 100% = 2.3%
To improve email click-through rates, first and foremost test and improve your copywriting. The words you use in your email campaign are meant to engage or persuade the recipient. Next, test the email’s design and layout, focusing on the call to action.
Finally, test your email segment. If the message is not relevant, even the best copy and design may not earn a click.
Click-to-open Rate
The click-to-open rate helps you understand how your email message is performing overall. For opens, it takes into account the message’s subject line and its segmentation. For clicks, the design and copy is important.
Click-to-open rate is sometimes shortened to “click rate.” Some email service providers have started to display it in campaign analytics. In fact, it is common for the click rate to be shown and click-through rate to be omitted. This practice has created some confusion.
Here the difference is that instead of dividing the number of unique clicks by the total number of emails sent (for the click-through rate), we divide the number of clicks by the total number of emails opened.
Say an online store sends 1,000 emails promoting the arrival of a new widget. If 120 recipients open the email message and 23 folks click at least one link in the message, the resulting click-to-open rate would be 19.1 percent.
(23 ÷ 120) × 100% = 19.1%
To improve the click rate, make the entire email message better: a improved subject line, tighter copy, and proper segments.