Google continues to migrate important search engine optimization tools to the new Search Console. Several more tools moved over the holiday season, making the new version just as important as the old.
But the new version can’t replace the old one just yet.
We still need to monitor our sites in both places. The old interface links to reports in the new version, but once in the new, you can no longer access the old reports easily without going back to the start (in the old interface). Still, it’s a small price to pay for this critical information.
If you’re still not verified to access Google Search Console, do it. It’s free and contains info found nowhere else.
Performance Report
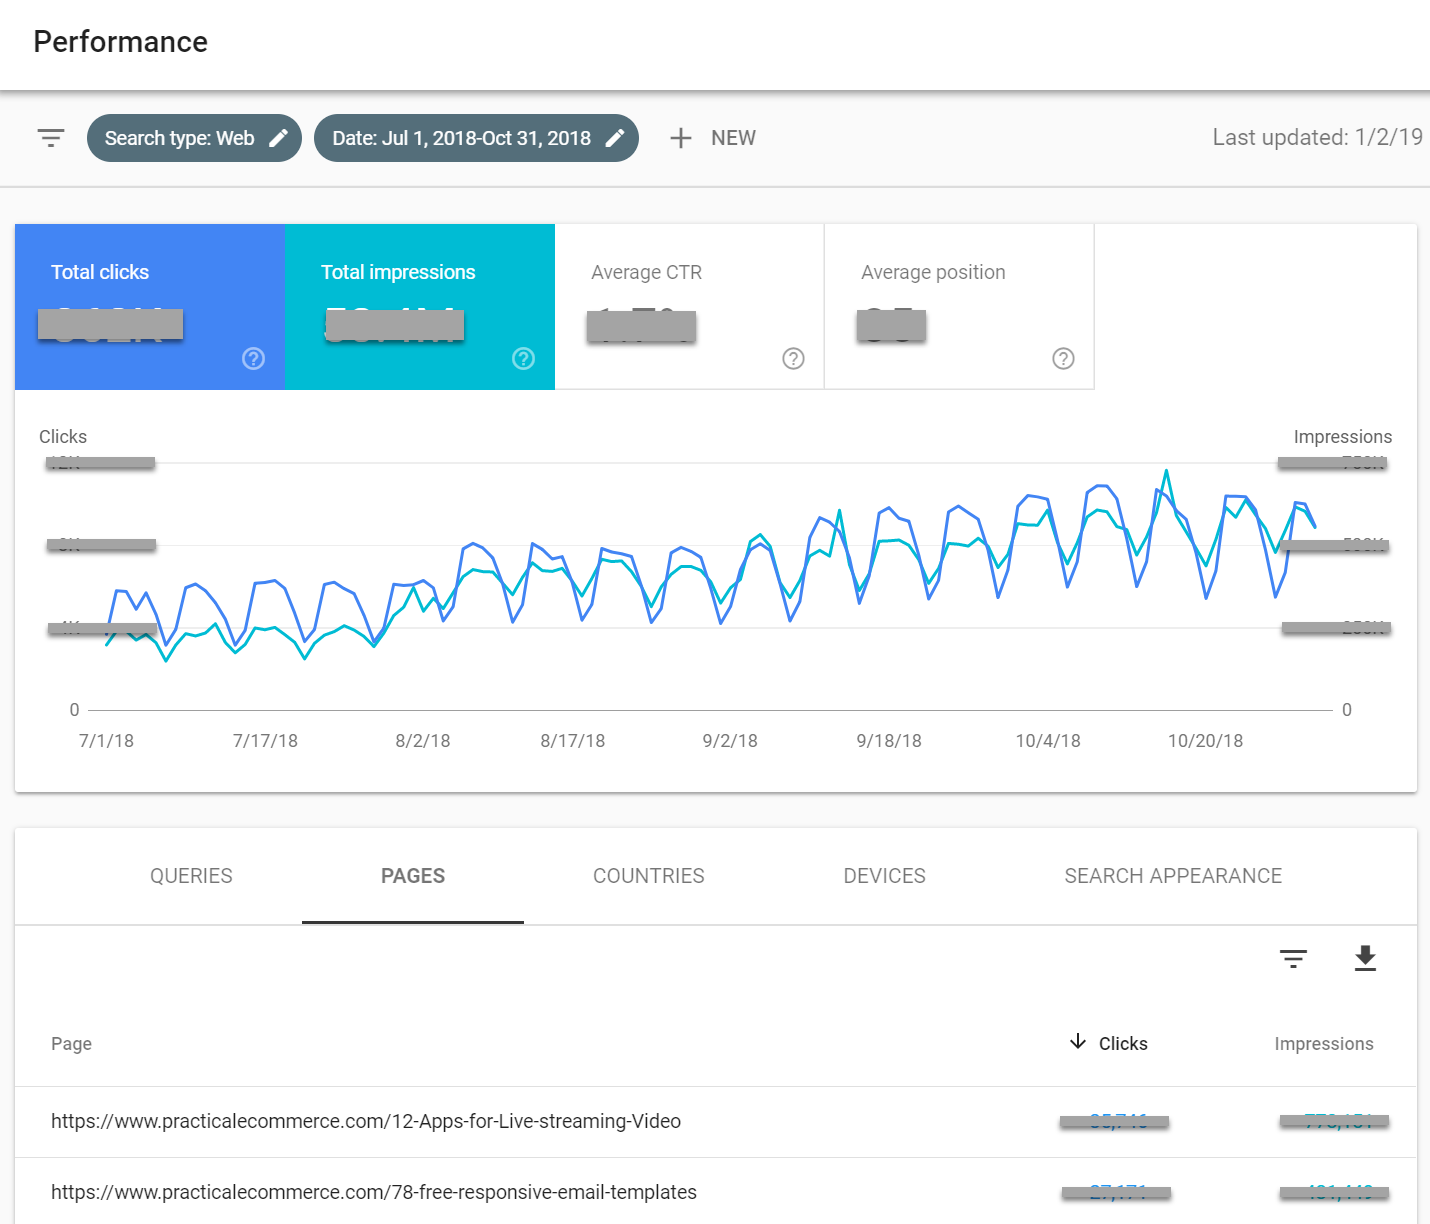
The new Performance report offers a wonderful 16 months of data on your site for Google web search, including impressions, position, click-through rate from the search results, and top keywords. Search Console is the only tool that contains impressions and keyword data. Both were located in the “Search Analytics” report on the old version.
Use the Performance report to augment your site’s regular web analytics data. The numbers in Performance and analytics won’t be the same, but they should be similar in their trends. If the number of Google natural search sessions in your web analytics is significantly different than the clicks in Search Console’s Performance report, check the analytics tags to be sure they’re firing correctly.

The new Performance report contains up to 16 months of site data on Google web search. This example shows three months. Click image to enlarge.
Links Report
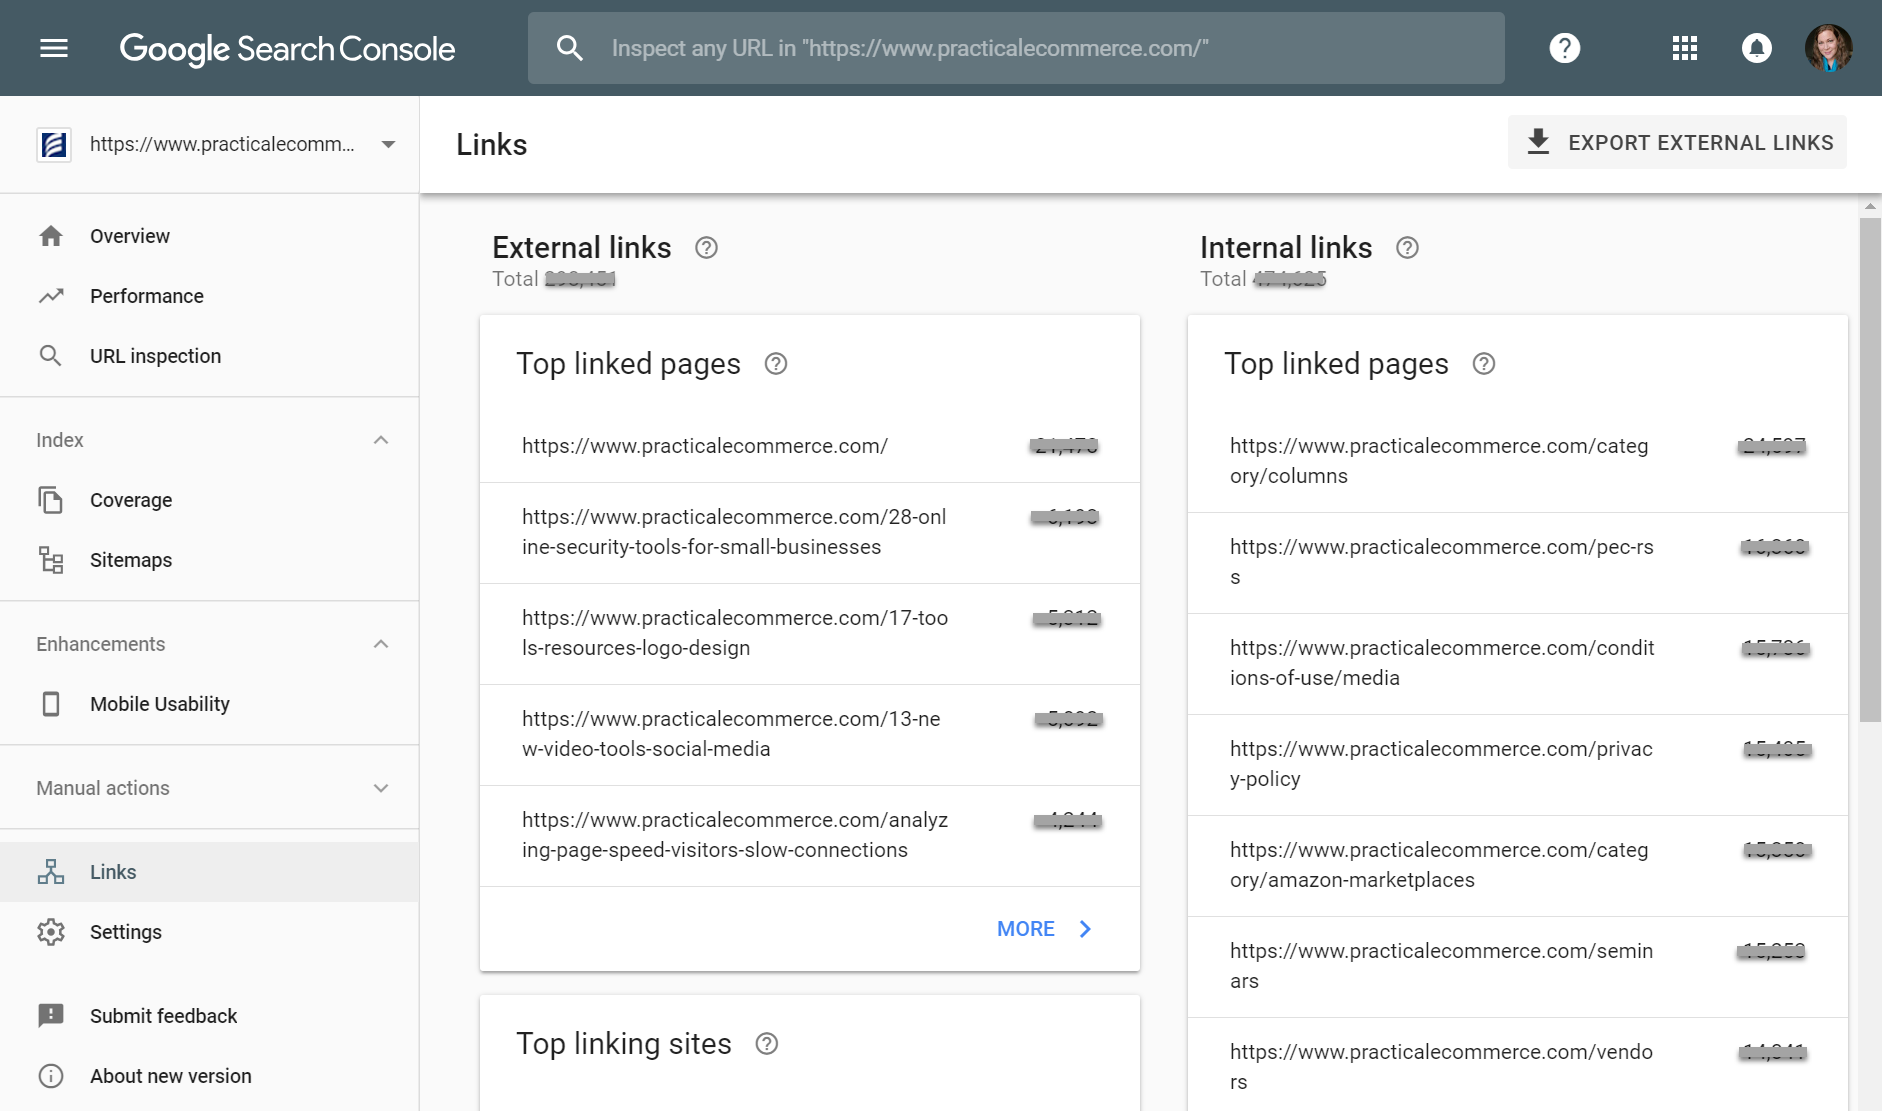
Divided into internal and external links sections, the Links report shows which sites and pages link to yours.

Google Search Console’s Links report shows internal and external link information. Click image to enlarge.
The first two reports are both labeled “Top linked pages.” The one on the left, under “External links,” shows which pages have the most links to them from pages on other domains. In other words, it shows which pages receive links from other sites. The report on the right shows your top pages with internal links — which pages receive links from other pages on your site. Both reports are ordered with the pages that receive the most links at the top.
The Links section contains a couple more external link reports. “Top linking sites” shows which sites link most heavily to yours. For example, the report might show that Wikipedia linked to 10 of your pages, and Yahoo Finance linked to three.
The “Top linking text” report shows the link text most commonly used when other sites link to yours. Likely the most common text centers around your company name. But if you click into the report, you have the option to filter the link text for certain keywords — just click on the upside-down triangle and “link text.” Then type a word or phrase where it says “Filter by Link text.”
Coverage Report
Called the “Index Status” report in the old Search Console, the Coverage report shows information on the indexation of all of the URLs on your site — which pages Google can and cannot index, and why. Indexation is where SEO begins. If your site isn’t indexed, all the optimization in the world won’t get you ranked.
The Coverage report displays information on common errors and crawl blockers, such as soft 404s, redirect errors, and which pages have been blocked by robots.txt and meta robots noindex tags. Some of these blocks have presumably been set on purpose, but it’s a good idea to review regularly to identify accidental blocks that impact performance.
URL Inspection
Learn more about individual URLs on your site with the URL inspection report. It includes information on indexation and mobile usability. When you suspect there’s a problem with a single page — or a page that’s part of a broader type, such as product detail pages — use this tool to identify the issue.
You’ll see if your page has been discovered and crawled and if it’s indexed. You’ll also see information on mobile usability, an important part of SEO performance now that Google is serving over half of its search results worldwide from its mobile-first index.
Mobile Usability
Aimed at improving the experience of searchers on smartphones, the Mobile Usability report identifies common problems, such a screen width and the placement of clickable elements.
Even if you have a responsive site, keep an eye on this report. Remember, it’s not how usable you think your site is that helps you rank better. Google decides algorithmically whether a site is usable on a mobile device, and how close is “too close” for clickable elements before they’re not usable with a finger.
Note that this report is a subset of what’s offered on Google’s Mobile-Friendly Test, which also offers information on page resources (such as images and JavaScript files) and shows a helpful HTML version of the rendered page’s code.
Manual Actions
The one sure way to determine if Google has assessed a manual penalty — i.e., banned your site — is to check the Manual actions report. This is Google’s way of communicating what it thinks your site has done to earn a penalty and to offer high-level info on how to resolve it.
The old Search Console’s Messages section will also report manual actions. And, in the event of a manual action, Google typically sends an email to verified users of Search Console as well.