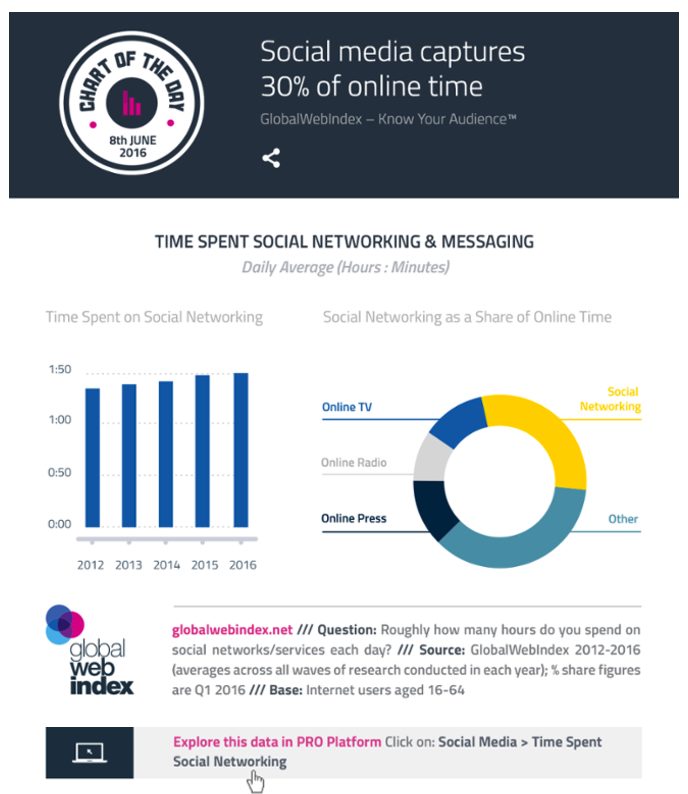
Chart of the day: How long do you spend on social media networks each day?
This chart looks at average daily time spent online and what we are actually doing with that time. It was reported that the most common reasons for using social networks are to “fill up spare time”. Users are now spending around 2 hours per day on social networks and messaging, that adds up to 5 years and 4 months spent over an average lifetime. This figure is up 15 minutes from 2012.
It’s perhaps no surprise as our infographic of the social media activity every minute shows.
The increase we see here will be due to how social media platforms themselves are evolving their tools and options to further attract and engage new audiences. As they evolve the more time we will spend there.
What does this mean for marketers? Start researching when your followers are most active and use this insight to make sure your content is targeted and reaching them at these prime times.

