Social media is abuzz with TikTok’s explosive growth. And that’s why understanding TikTok analytics so important. Track the right metrics, and you’ll be able to tell hype from reality.
If your brand is new to TikTok, analytics can take some of the guesswork out of content strategy. Insights available to TikTok pro accounts can inform everything from when you post to what you post.
Learn which TikTok metrics you should be tracking, where to find them, and how you can use them to your advantage.
Bonus: Get a free social media analytics report template that shows you the most important metrics to track for each network.
What is a TikTok pro account?
The main difference between a TikTok pro account and a regular account boils down to TikTok analytics. Pro accounts offer them, while regular accounts don’t.
How to switch to a TikTok Pro account:
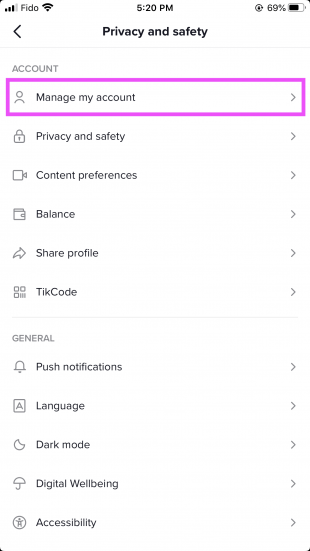
- From your profile page, click the three dots in the upper right corner.
- Choose Manage My Account.
- Tap Switch to Pro Account.
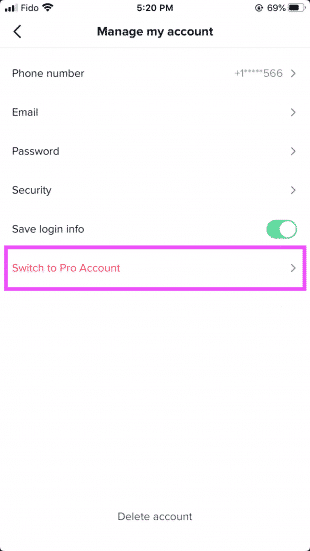
- Choose an appropriate category and gender.
- If you did not sign up with your phone number, you’ll be asked to add one followed by the confirmation code you receive.
How to check your TikTok analytics
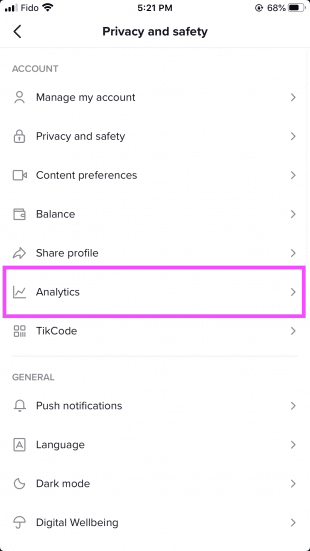
Wondering where to find TikTok analytics? From your profile on mobile, click the ellipsis in the top right. Under Account, you should see an Analytics tab.
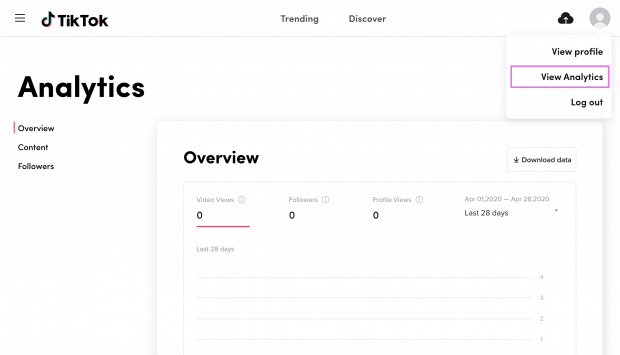
Here’s how to see TikTok analytics on desktop. Login to TikTok, click your profile picture, then select View Analytics. If you plan to download data you can only do this from the desktop dashboard.
TikTok followers analytics
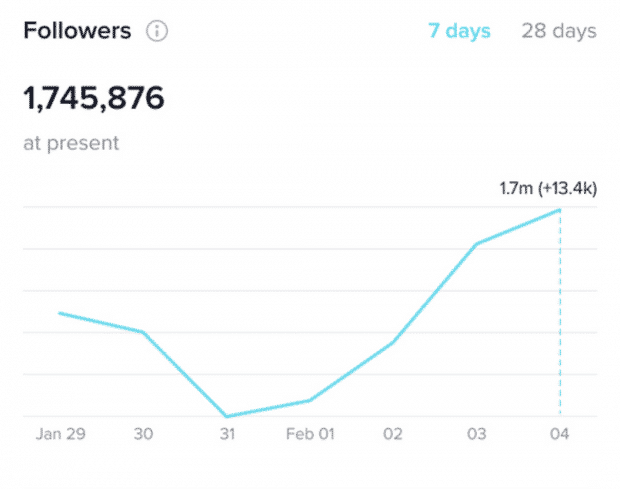
Your TikTok followers analytics first appear in a graph format from the Overview tab. Toggle between the 7-day or 28-day view to chart your account’s short and long-term growth patterns.
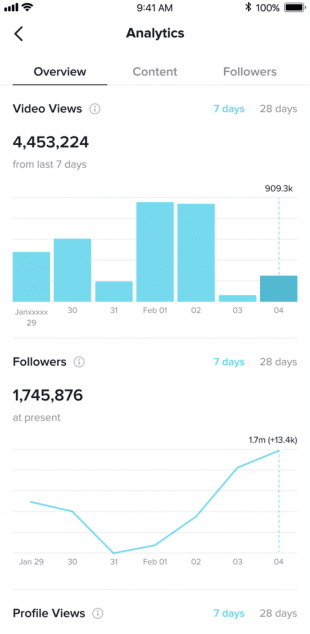
For deeper audience insights, click the Followers tab in the upper right corner. This section includes gender and location demographics as well as follower activity, videos your followers watched, and songs your followers listened to.
TikTok profile analytics
Get a snapshot of your TikTok profile analytics from the Overview tab. Scroll past the Followers graph to see your Profile Views. Switch between a longer 28-day view or a 7-day close up to pinpoint spikes in traffic.
TikTok video analytics
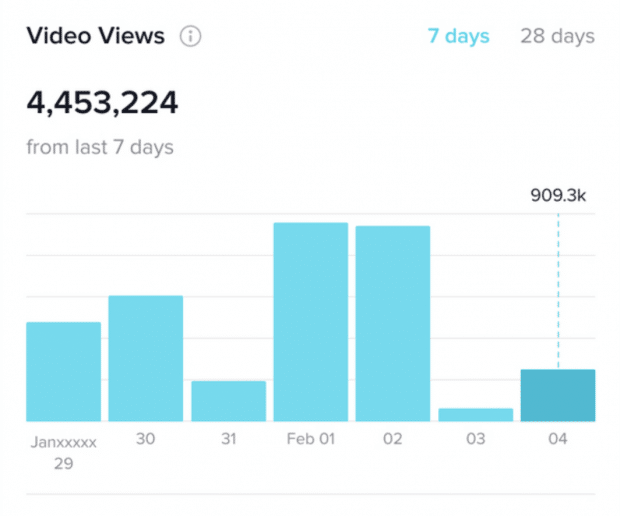
The most extensive insights TikTok offers are for videos. From the Overview, you’ll find a bar chart that displays video views over the past week or month. To drill down on specific TikTok video analytics, go to the Content tab.

In this tab you’ll be able to see recent and trending posts from the last seven days. You can click on any video to see total likes, comments, shares, play time, traffic source, audience demographics, and more.
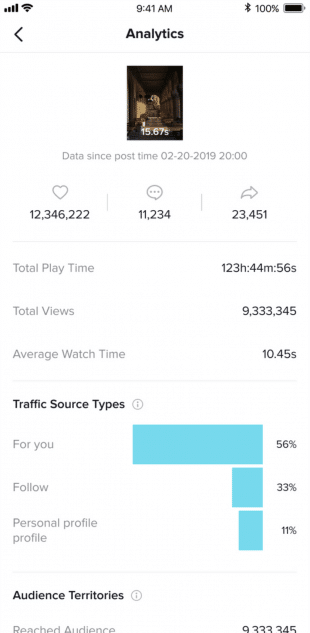
You can also check out TikTok video analytics from your profile page. Open the video, tap More (…) and then select Analytics.

Understanding TikTok metrics
“Viral” is a word that comes up often in relation to TikTok. But the buzzword doesn’t mean much unless it’s backed up with the right data. Here’s a rundown of the TikTok analytics you should keep your eye on, and why you should track them.
TikTok Analytics Overview
The Overview tab offers a summary of the following metrics.
Video views: The total number of times your account’s videos were viewed over a given period.
Followers: The total tally of TikTok users that follow your account
Profile views: The number of times your profile was viewed over the selected period. This TikTok metrics is a good indication of brand interest. It measures the number of people who liked your video enough to check out your profile, or people who are curious to see what your brand is up to on the platform.
Follower Tab
Visit the Follower Tab to learn about your audience. In addition to key demographic stats, you can also see what your followers are interested in, making this section a good source for content inspiration.
Gender: Here you will find the distribution of your followers by gender. If you’re happy with your niche, keep playing to your crowd.
If you’re looking to grow your audience, consider creating content with more universal appeal. Or partner with a relevant influencer to gain exposure with different crowds. For example, a cosmetics brand may wish to team up with a TikTok influencer like Tyler Brown to reach his audience.
@tylerbrownThe Grinch ##makeup tutorial!! ##fypage ##tiktok ????✨♬ I’m booked – How the Grinch Stole Christmas
Top territories: Where your followers are from, ranked by country. Keep these places in mind incase it makes sense to localize content and promotions. A maximum of five countries are listed here.
Follower activity: This shows you the times and days that your followers are most active on TikTok. Look for when activity is consistently high, and post regularly in that time slot.
Videos your followers watched: This section allows you to get a sense of the content that is most popular with your followers. Have a look at this section often to see if it sparks any ideas for content. It’s also a good place to scope out potential collaborators.
Sounds your followers listened to: TikTok trends are underscored by tracks, so check the top sounds your followers have listened to see what’s popular. Trends move fast on TikTok, so if you use these results for ideas, plan for a quick turnaround.
Content Tab
From the Content tab you can measure the performance of your content.
Trending videos: Shows you your top nine videos with the fastest growth in viewership over the past seven days.
Individual Post Stats
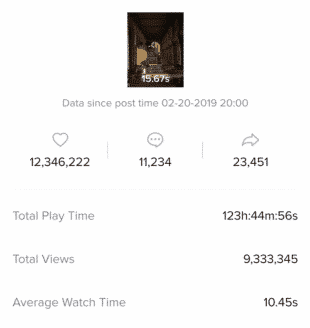
Total like count of post: How many likes a post has received.
Total number of comments: How many comments a post has received.
Total shares: The number of times the post has been shared.
Total play time: A cumulative total of the time people have spent watching your video. This stat does not reveal much on its own, but can be compared with other posts to determine your account’s average total play time.
Total video views: The number of times a post has been viewed.
Average watch time: The average amount of time people spent watching your video. This will give you a good indication of how successful you were at maintaining attention.
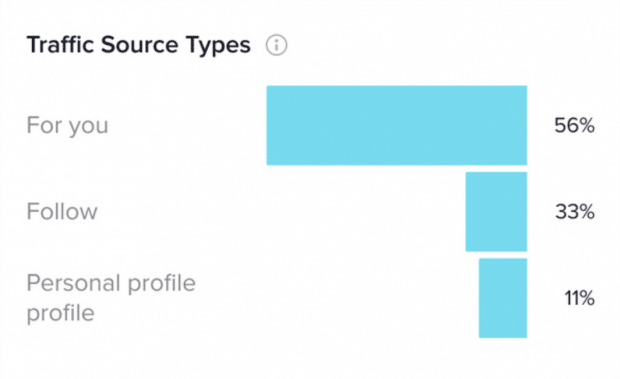
Traffic source types: Where traffic for your post comes from. Traffic sources include the For You feed, your profile, Following feed, sounds, searches, and hashtags. If you’re using hashtags or sounds to boost exposure, here’s where you’ll see how well that worked.
Audience territories: This section displays your reached audience (total number of users who watched your video) and the top locations of viewers for the post. If you created a post or campaign for a specific location, here’s where you’ll see if it reached them.
Other TikTok Analytics
Hashtag views: The number of times posts with a given hashtag have been watched.

To see how many views a hashtag has received, search for the hashtag in the Discover tab. An overview of the search results will appear in the Top tab. From there you’ll be able to see the number of views, related hashtags, and some of the top videos that use the tag.

Total likes: From your TikTok profile, you can see a grand total of the number of likes you’ve seen on all your content. This TikTok metric could be used for a rough estimate of average engagement.
TikTok engagement rates: There are different ways to calculate social media engagement rates, and TikTok is no different. These are the two primary formulas marketers use:
((Number of likes + Number of comments) / Number of Followers) * 100
((Number of likes + Number of comments + Number of shares) / Number of Followers) * 100
Since like and comment metrics are visible on the platform, you can easily see how your TikTok metrics compare with other accounts. Or scope out the engagement rates of influencers before teaming up with them.
Average engagement estimate: For a back-of-the-envelope estimate of an accounts’ average engagement, try the following.
- From a profile, click Likes to see the full total.
- Count the number of videos posted.
- Divide likes by the number of videos.
- Divide this number by the accounts total number of followers.
- Multiply by 100.
Keep in mind that most engagement rate formulas include comments in addition to likes, so you shouldn’t compare these results with those calculations. But since it’s time consuming to count overall comment totals, this formula can be used as a quick way to compare accounts in-house.
Ready to start advertising on TikTok? Learn how here.
