Chart of the Day: Which personalization techniques are most popular?
There are now many website personalization services available (our listing identifies 28), but how popular are they? This new research is useful to businesses considering adopting website personalization since it explores how many businesses are using different types of personalization.
The benefits of personalization are compelling, regardless of the type of business. Once set up, it can automatically deliver an improved customer experience and increase conversion by recommending relevant products and customers to nudge visitors along the customer journey. Such recommendations services are well-known and widely deployed in ecommerce, especially retail, but there are options to use them in other sectors like travel and financial services. Our article identifies 4 categories including B2B, where personalization services can recommend the ‘next-best content’ to nurture prospects.
How Widely Adopted Are Different Personalization Techniques?
Across all companies surveyed, more companies are using personalization for email marketing (72%) compared to Website (57%) and mobile website (28%). This suggests that businesses either find email personalization easier to set up or more valuable.
Which parts of the website are personalization being used on?
The chart shows that just because a personalization tool has been adopted, it’s not necessarily being used across the whole customer journey.
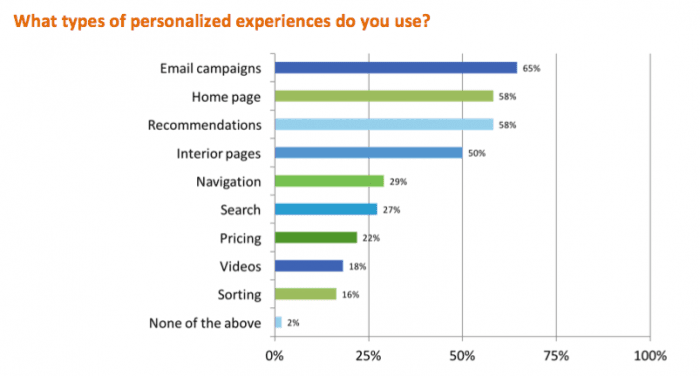
Homepages and ‘interior pages’ recommendations, presumably category and product pages are most popular. Personalising navigation and search are less common.
Is Machine Learning or algorithmic targeting being used for personalization?
Given the hype on artificial intelligence, it was interesting to see a question on this. The majority (67%) are still using the classic rules-based personalization, but a quarter are using rules plus machine learning which we can expect to be the future pattern.
Which criteria are used for targeting visitors?
Criteria for targeting include both automatically observed behaviours or characteristics such as content viewed, location or device and disclosed demographic profile information such as gender or company sector (although this can potentially be inferred).
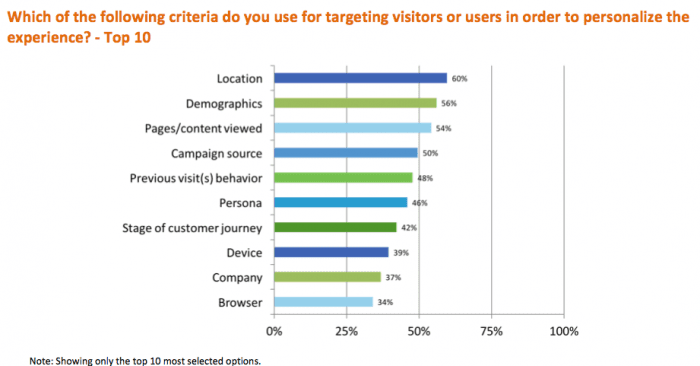
The research shows that both observed and disclosed criteria top the list. It is surprising to see that stage of the customer journey is relatively low since nurturing with different content through the customer lifecycle is a key benefit of personalization.
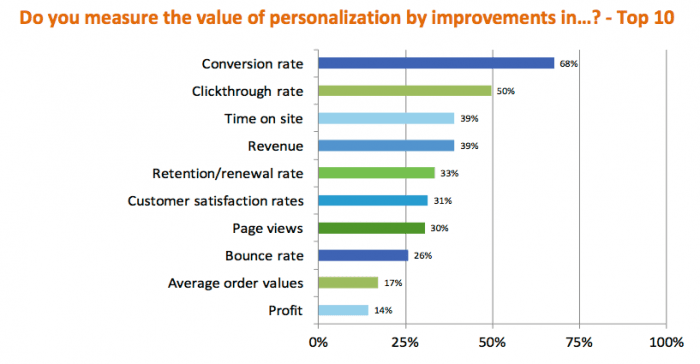
Which criteria are used for measuring personalization?
No surprises here, conversion tops the list since whether it is B2B or B2C companies are typically using personalization to boost conversion to lead or sale. Revenue (measured by revenue per visit) is relatively low since the sample included many B2B companies for which personalization is less relevant. It is interesting to see that the impact on customer satisfaction after implementing a personalization programme is also used by some businesses.
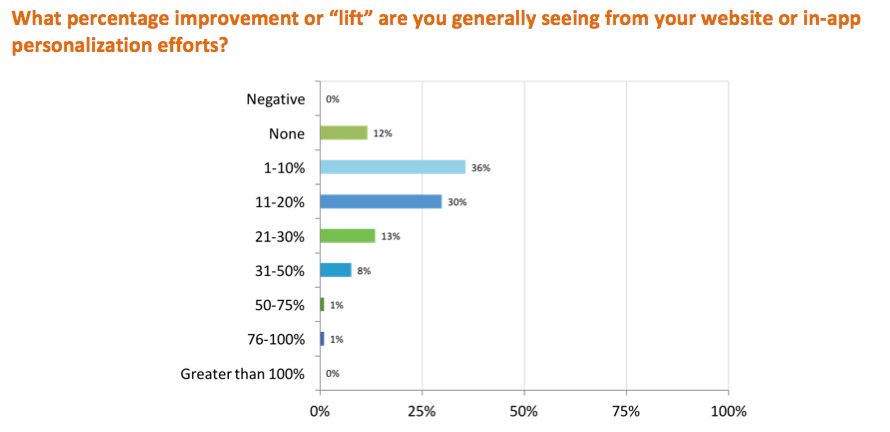
What improvement in revenue can personalization deliver?
This is a useful chart for benchmarking since it can support the business case and is also useful for expectation setting. It would be interesting to see this broken down by sector and to know whether the lift is measured by clickthrough rates or revenue.
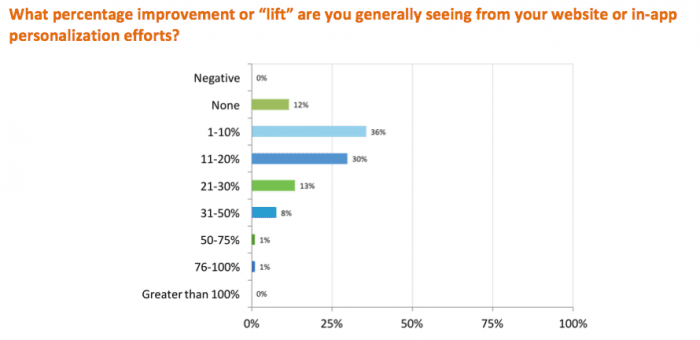
The survey suggests that personalization shouldn’t be seen as a ‘silver-bullet’, with nearly half of companies gaining less than 10% uplift, which given the cost of implementing personalization may mean that a positive ROI isn’t achieved. However, these may be limited deployments not using all the features and 43% are seeing an uplift of 10 to 30% which is compelling regardless of how you are measuring lift.
