April 12, 2018
AdWords geographic reports provide performance data by location. You can use this data to optimize campaigns by identifying the best or worst performing states, create new bid modifiers for specific cities, or examine the performance of your current targets. All of this information is vital to identifying efficiencies and growth opportunities.
In this article we will cover the three main rebuilt reports in AdWords and cover their uses.
User Location Report
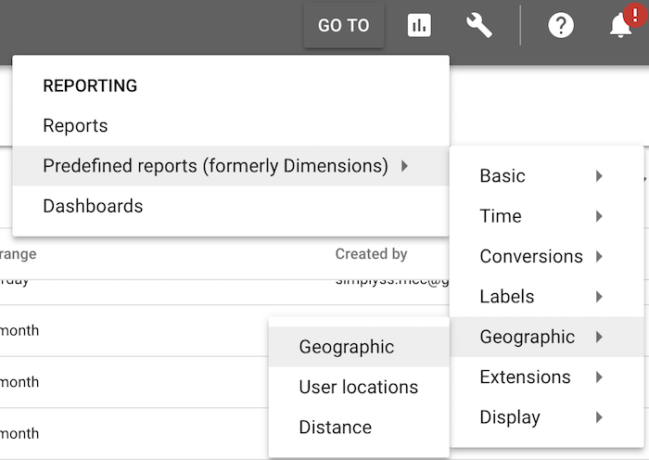
The user location report breaks down performance by country, region, city, DMA, and sometimes the zip code. You can access this reports through Predefined Reports > Geographic > User Locations.

This is the rawest version of the geographic data you can access. The data is not associated with existing targets and can be easily subset or aggregated. For example you are targeting the United States. Rather than being given information only at the country level (your explicit target) you can break the data down by state or city regardless of targeting the higher level country.
You can select/remove these levels at any time via the menu.

Report column settings
The ability to control the level of detail makes this an essential report for identifying locations to specifically target or adjust. This could be a campaign where you target the entire country but want to set up separate targets for individual states and more control. Perhaps you have a sporting goods store that performs better in certain climates and regions than others so you modify your bids to be more aggressive in these regions.
Since the data isn’t tied to a specific target, this report is especially helpful when you are looking across campaigns. Rather than dealing with the different targets you can export that data as is and perform whatever analysis you need. The format also makes it easier to line up with external data sources when needed.
Geographic Report
The geographic report is very similar to the user location report but includes an extra column for user type. This additional column segments between user location (what we saw in the report above) and user interest in location.
While user location reports specifically on performance where the user is, the geographic report includes information on those users outside of an area searching for the area. I often find more use in the geographic report due to the location settings I most often use but choose which one works best for your specific account.
By default, the AdWords location targets target people in a location and people showing interest in a location (such as searching for travel destinations in a city). If you are interested in how this could affect your account, check out Are Your Ads Showing Where You Think They Are.
Locations Report
You can also see your data aggregated by geographic target. This is especially helpful if you already have a developed targeting system in place, only target small radii, or when you are only assessing your current set up.

You can access this data via the locations tab. Once open you can will see every targeted location, campaign, and bid adjustment along with any desired metrics.
You can use this this data to evaluate performance by target and adjust your existing location bid modifiers as needed. If you have the same targets across a set of campaigns (for example different services in the same area) you can export the data and recombine it to get a better idea of performance. While this feels more limiting than the robust user location or the geographic report, it works much better with radius or zip code targeting data as the top level segments are already subset into that structure.
You are using location extensions
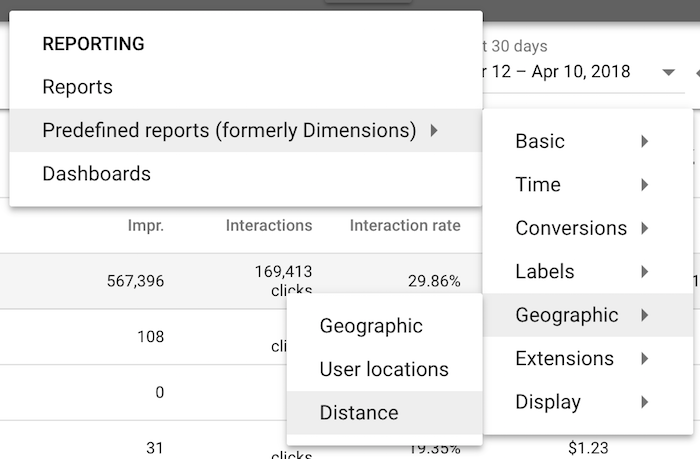
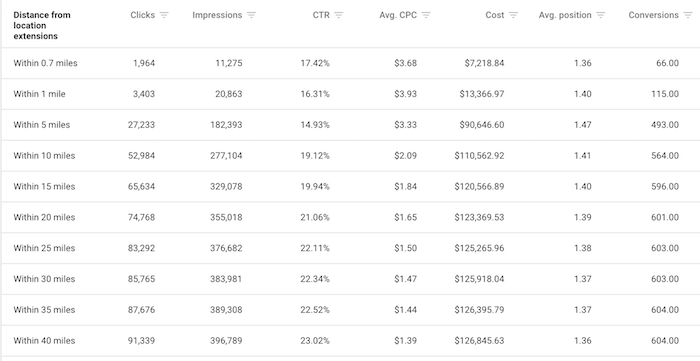
Location extensions data offers all the data above as well as the distance report. The distance report provides a breakdown of performance by distance from the extension. You can find this information under Predefined Reports > Geographic > Distance Report.

Unlike the other data sets this report features a proximity analysis without having to set up specific radius targets ahead of time. You can use this information to see the changes in performance based on distance from your location. If there are drastic changes you can set up radius targeting to leverage your best performing proximities.

If you offer services, such as a veterinary office, how does performance change based on range? In some areas 5 miles might be the limit before users stop clicking. In more rural areas, where further distances to services are more common, you may find that 15 or 20 miles Is the sweet spot before performance drops off.
The only downside to this report is that you are limited to the preset ranges. If you want to compare 3 to 5 miles or 5 miles to 7 miles you’ll need to set up specific radius targets via the campaign settings.
When to Check This Data
We’ve covered the major reports. Where you take it from here depends on your needs. I recommend periodically checking locations and modifiers to make bid adjustments. In most cases there is little reason to check this frequently but it should be part of your quarterly routine.
You can also combine your geographic data with impression share data to better understand your reach. Have you maxed out a specific area? If you are targeting a city but your impression share is maxed out your only opportunity for growth may be to expand your targets. If you can’t expand your targets you know you’ll need to focus on CRO or other channels to grow.