It is almost impossible to sell something online and not compete with Amazon. But how can you attract more direct buyers to your site?
Through superior service and expertise.
For example, think about small, popular restaurants. These places are busy even as they compete with large, well-known chains. What is it about these smaller establishments that keep them thriving even when competing with larger rivals? It’s their expertise in providing good food and exceptional, personalized service. They honed their skills with years of practice. They’ve acquired insights that are difficult to replicate at the scale, which is required by bigger businesses.
Consider the experience of buying mattresses at Wayfair. Compared to Amazon, Wayfair is a small company. But it has deeper expertise in selling mattresses, with a greater selection and more filtering options than Amazon.
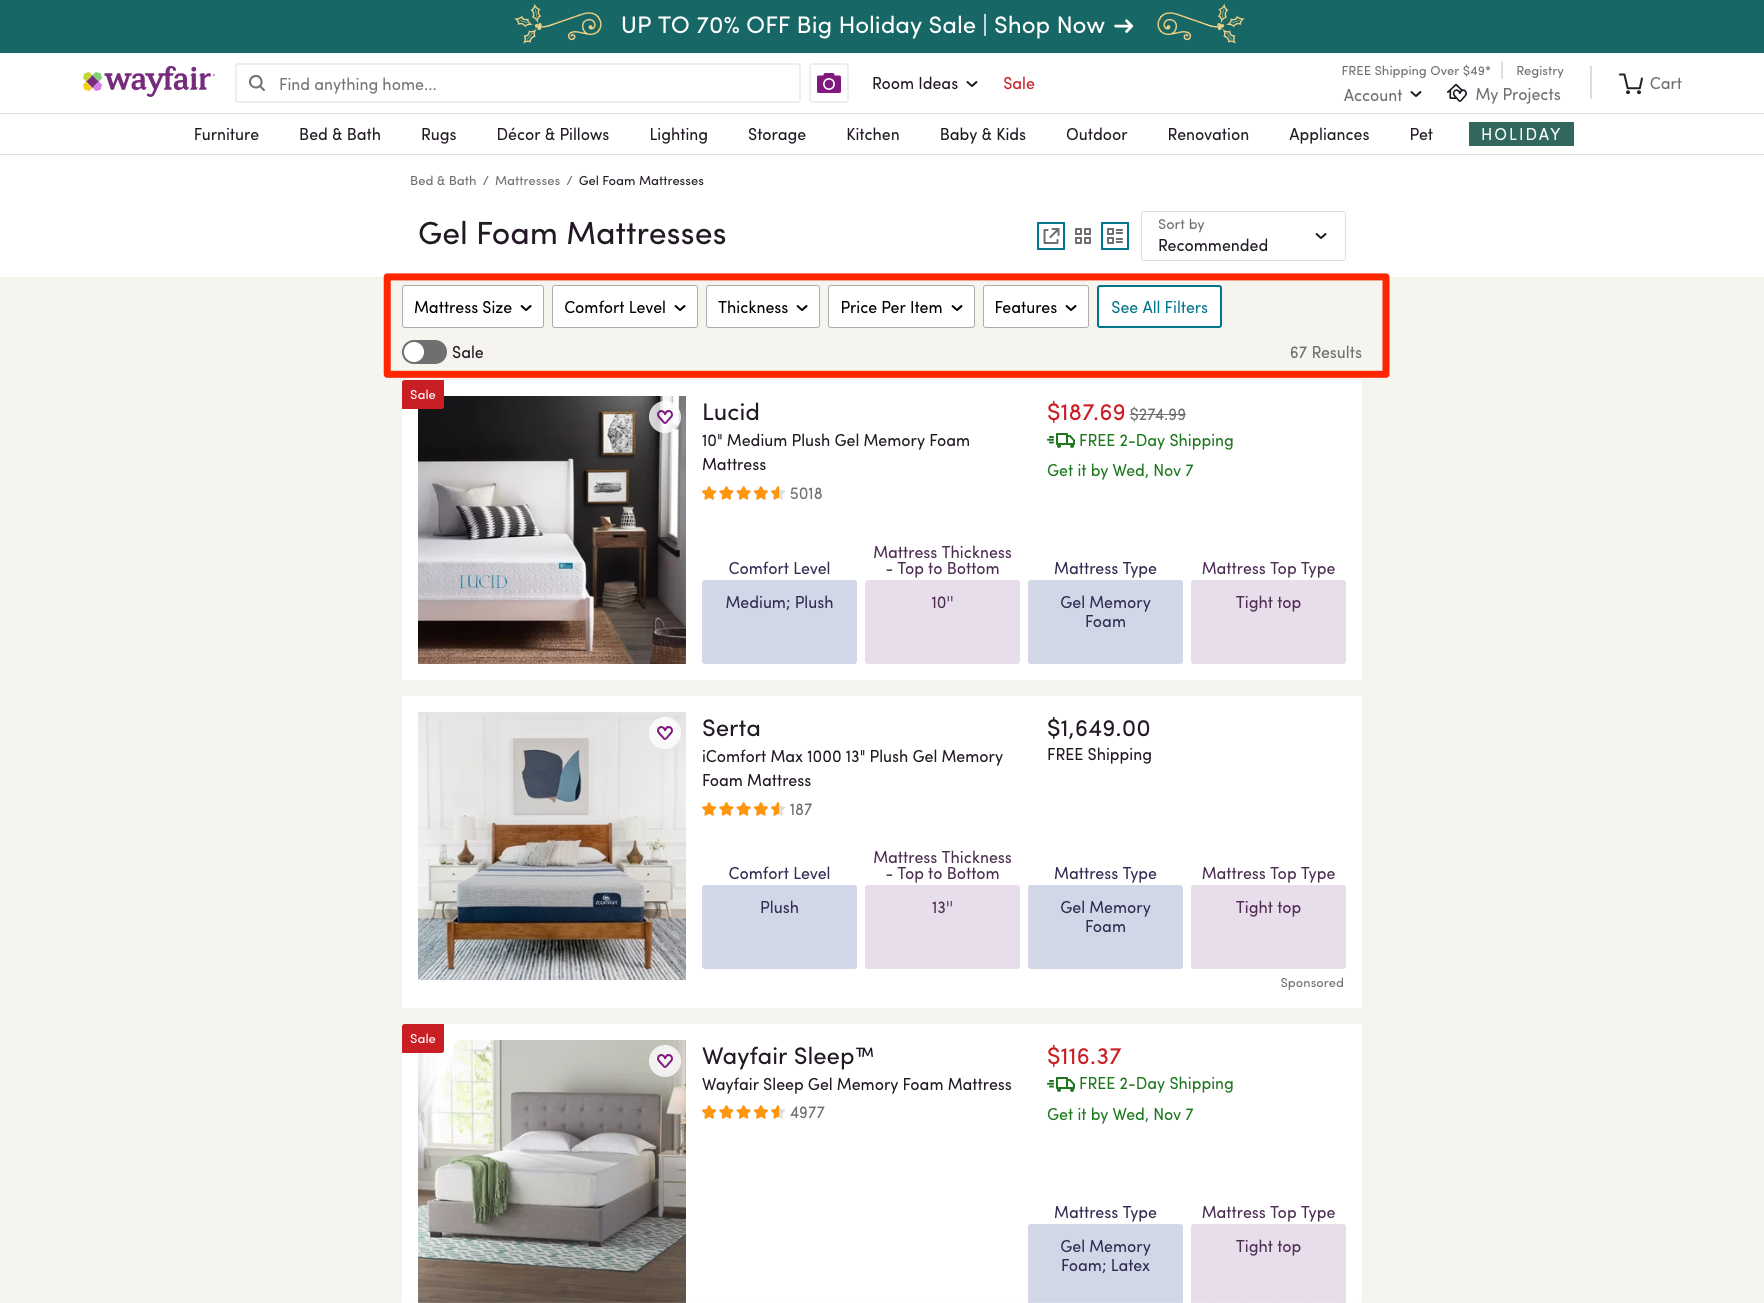
Wayfair has a greater selection of furniture and far more filtering options than Amazon. Click image to enlarge.
Wayfair’s pages are generally more helpful, with complementary information to help buyers make the right choice. Compare this to Amazon’s generic pages, which have limited, category-specific personalization. Amazon has too many products and categories to match Wayfair’s expertise on mattresses.
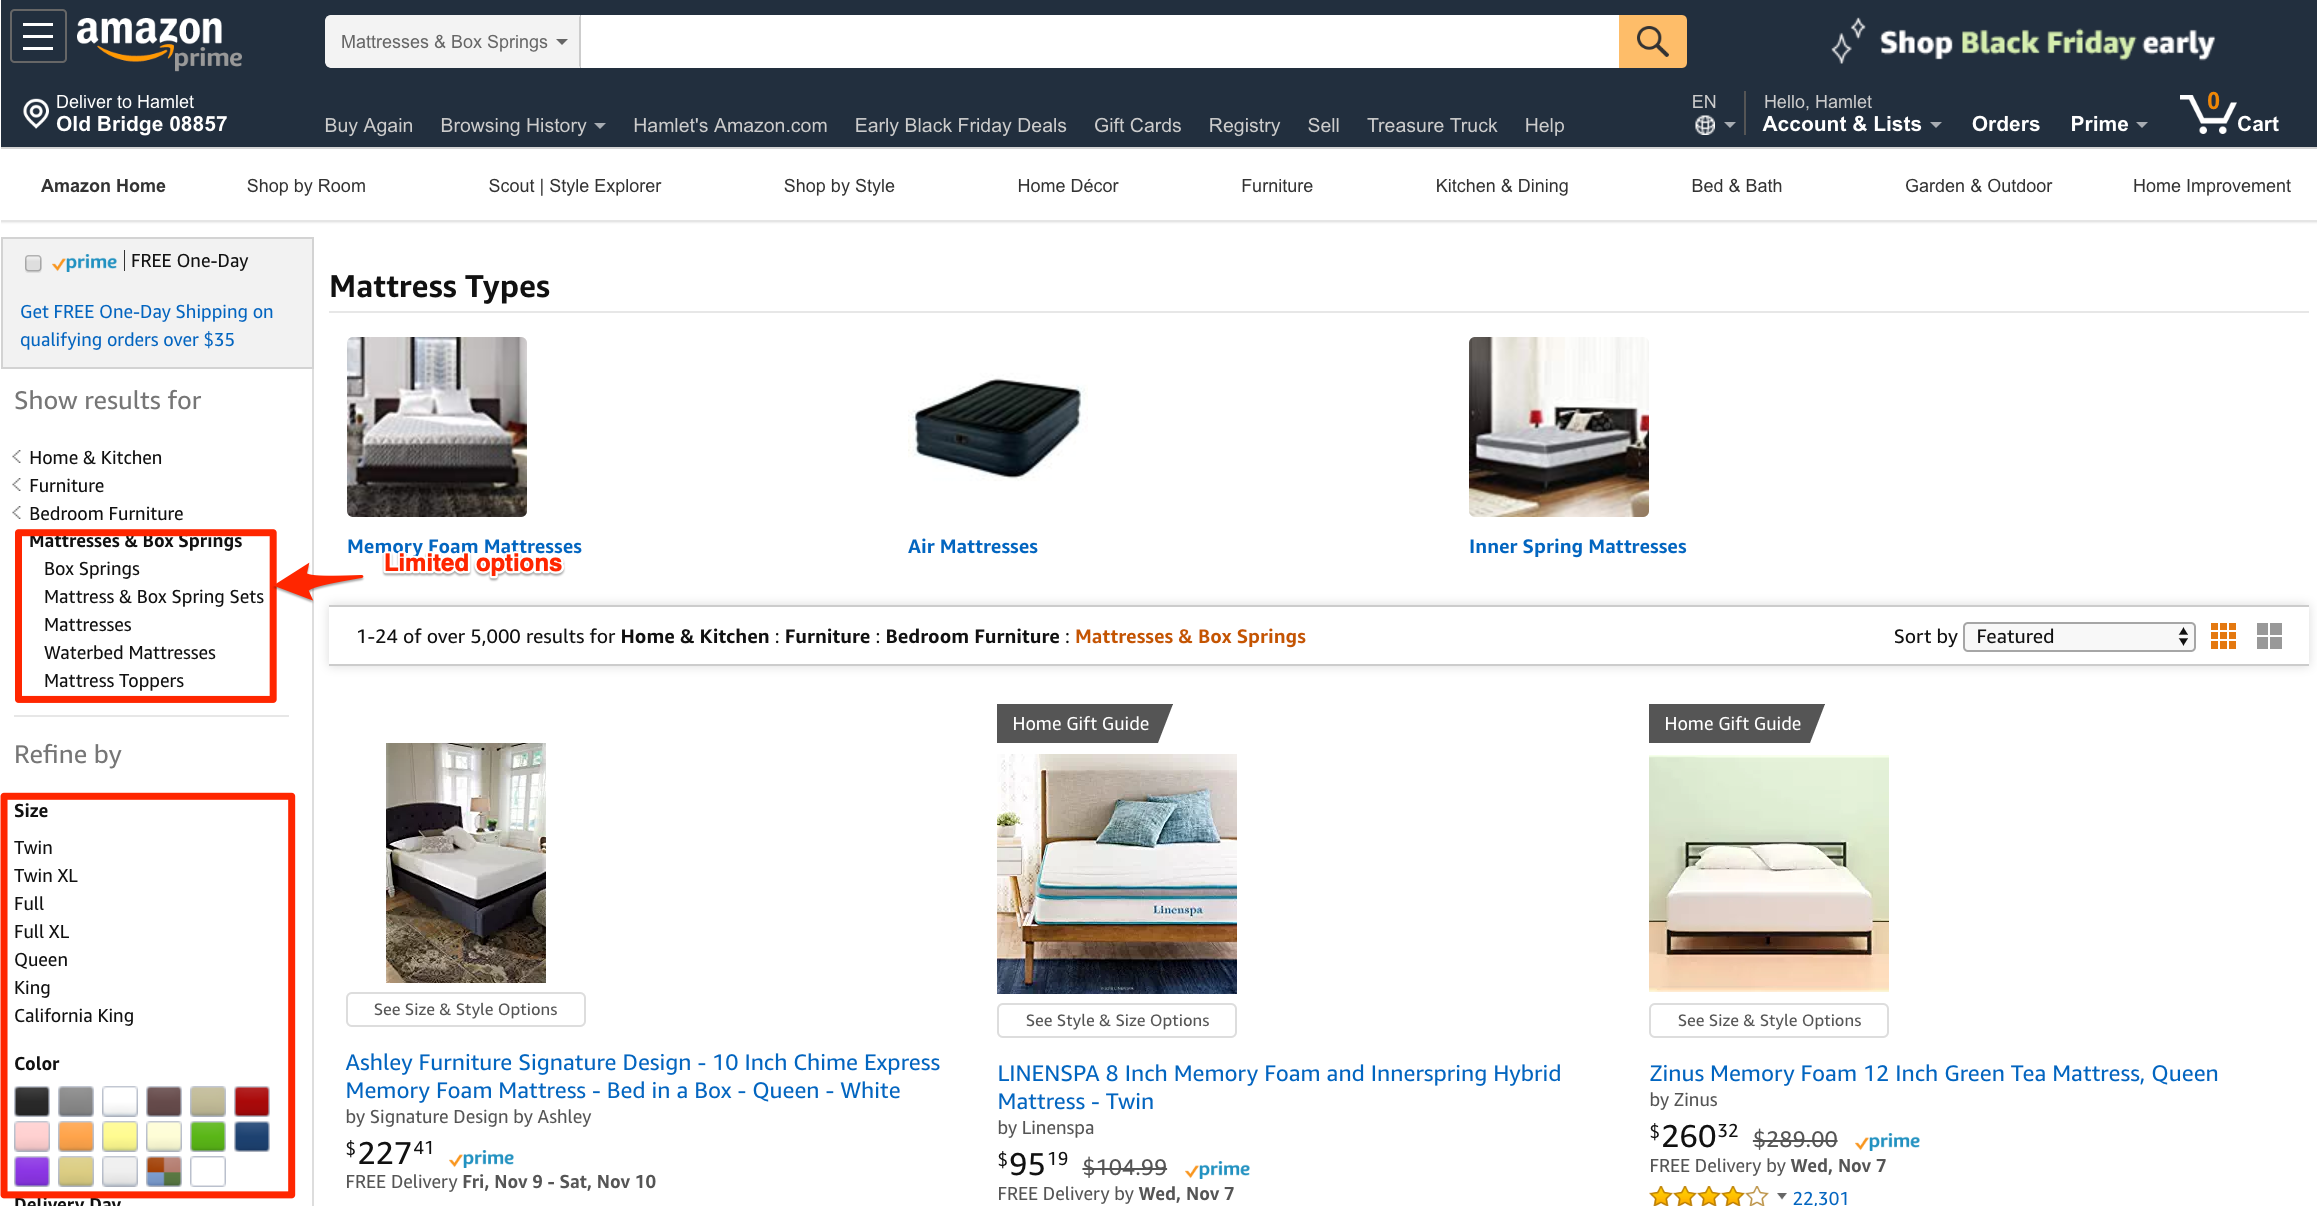
Amazon cannot provide the same sort of categories for mattresses as Wayfair. Click image to enlarge.
In other words, smaller merchants have expertise that Amazon does not. Smaller merchants can provide a superior experience. Shoppers can feel as if the site is built for them.
Improving User Experience
One of my clients, a B2B manufacturer, is embarking on a project to revamp the ecommerce experience for some of its key customer segments. The client sells products for large buildings, such as hospitals, schools, and commercial facilities. It has a large selection of products and wants to organize them so that potential buyers from those groups of customers — hospitals, schools, commercial facilities — can find them quickly.
The most common way to do this is with user experience teams, who attempt to improve the shopping process, roll out the changes, deploy A/B tests, and hope for the best.
But there is a better way.
In addition to brainstorming user-experience ideas, observe the behavior of actual users in Google Analytics. Try to find areas of friction where the path-to-purchase can be improved.
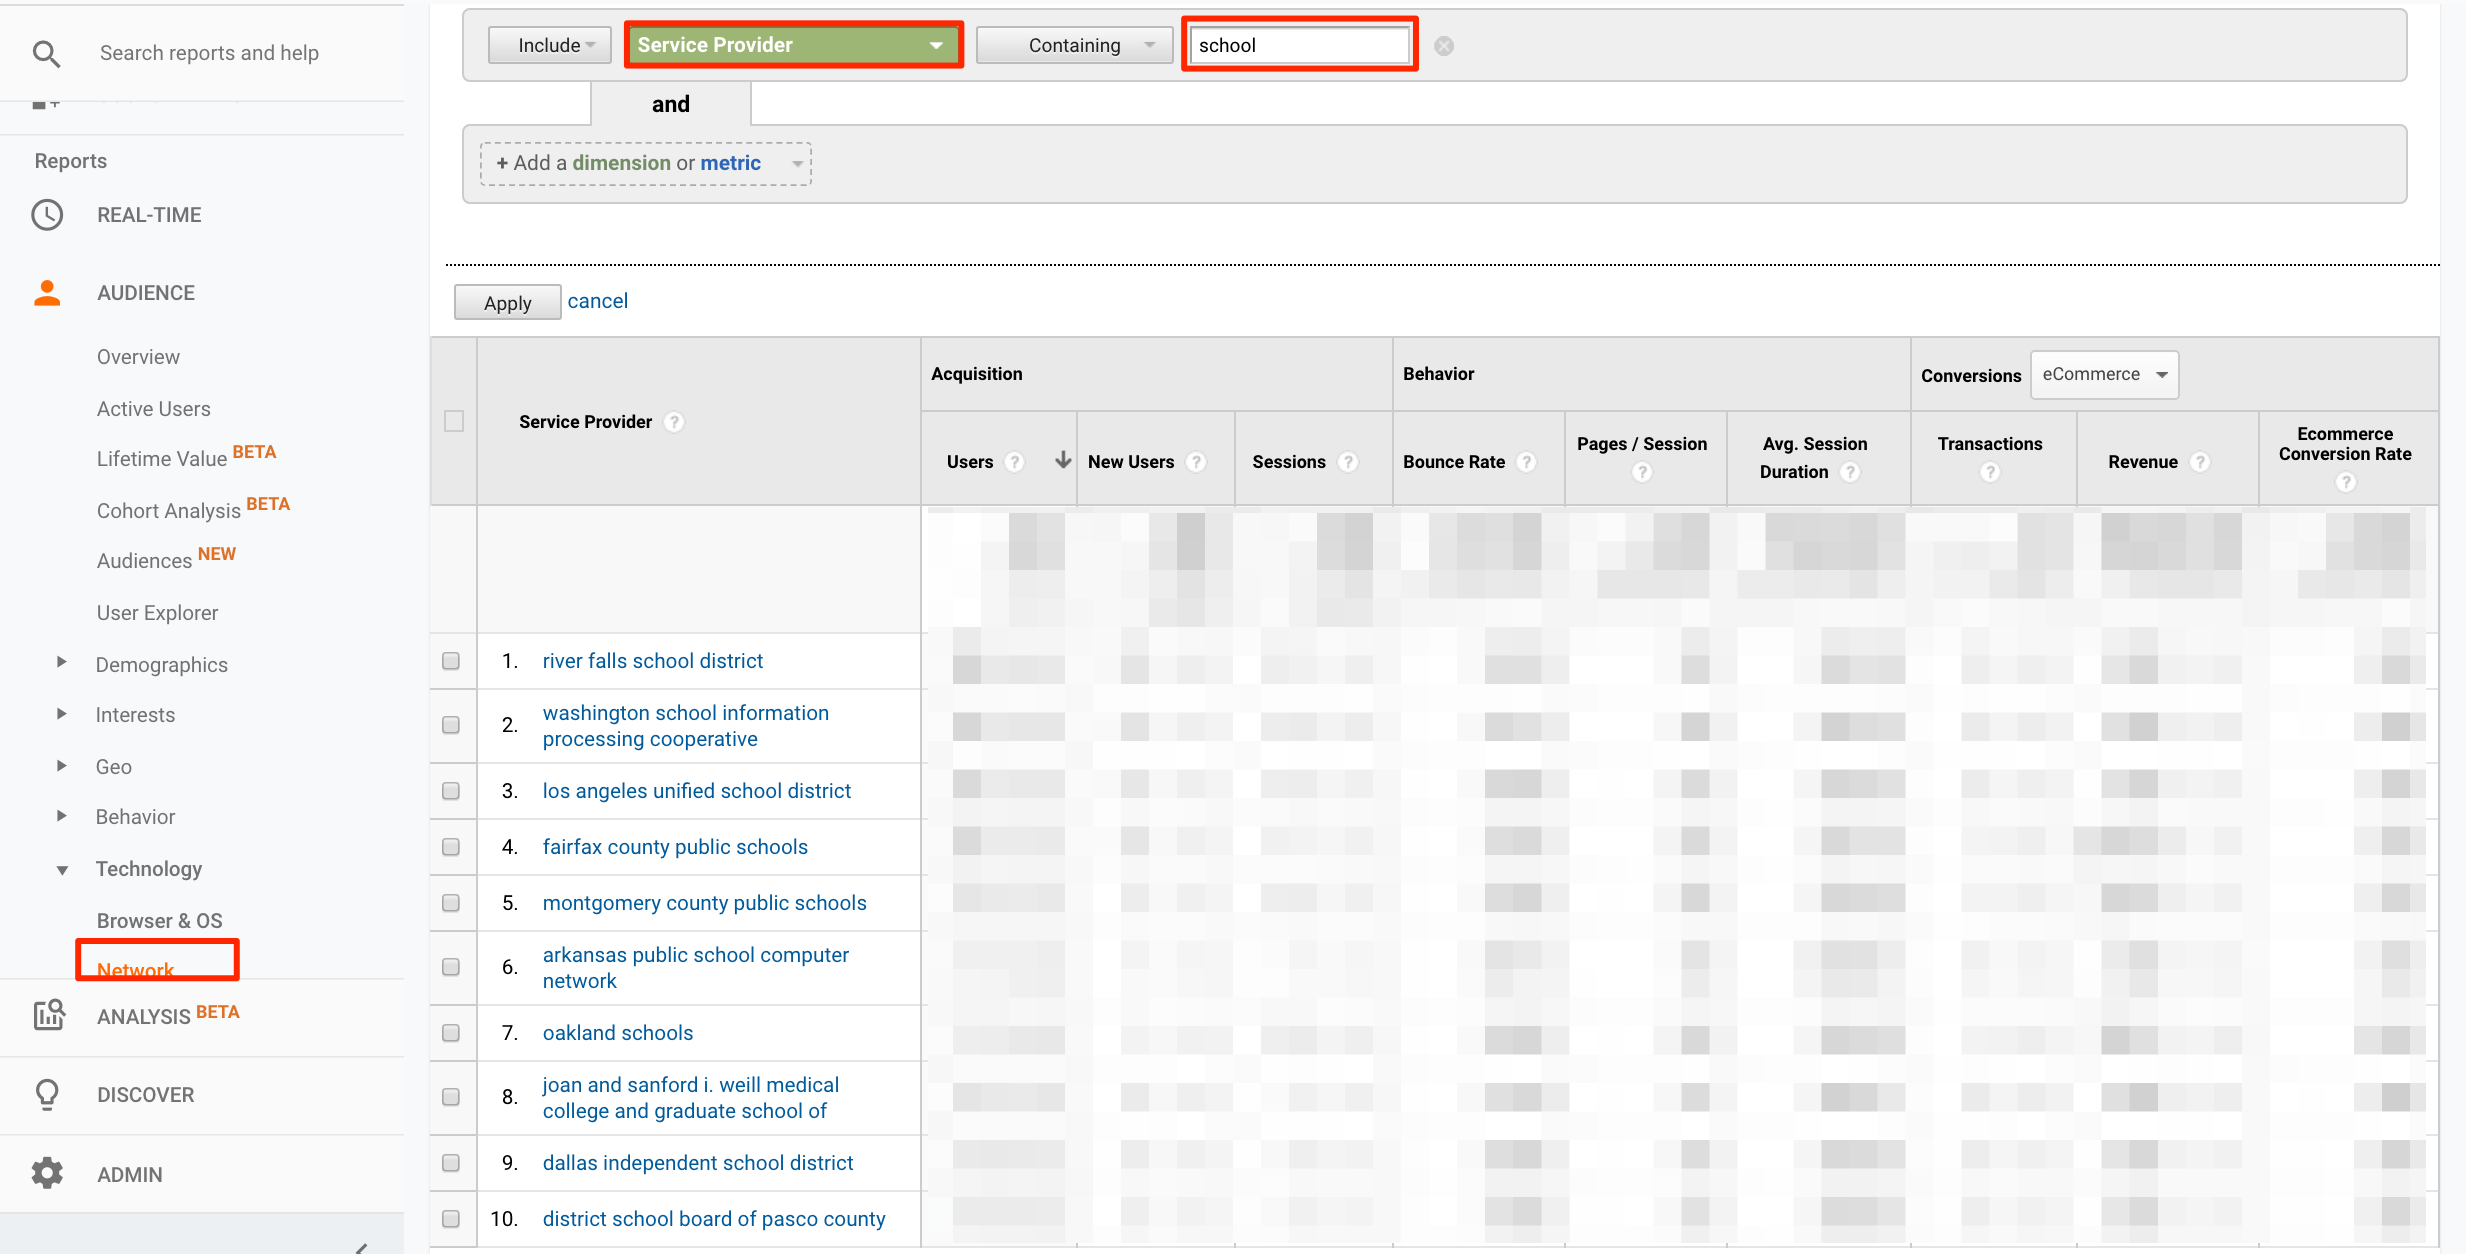
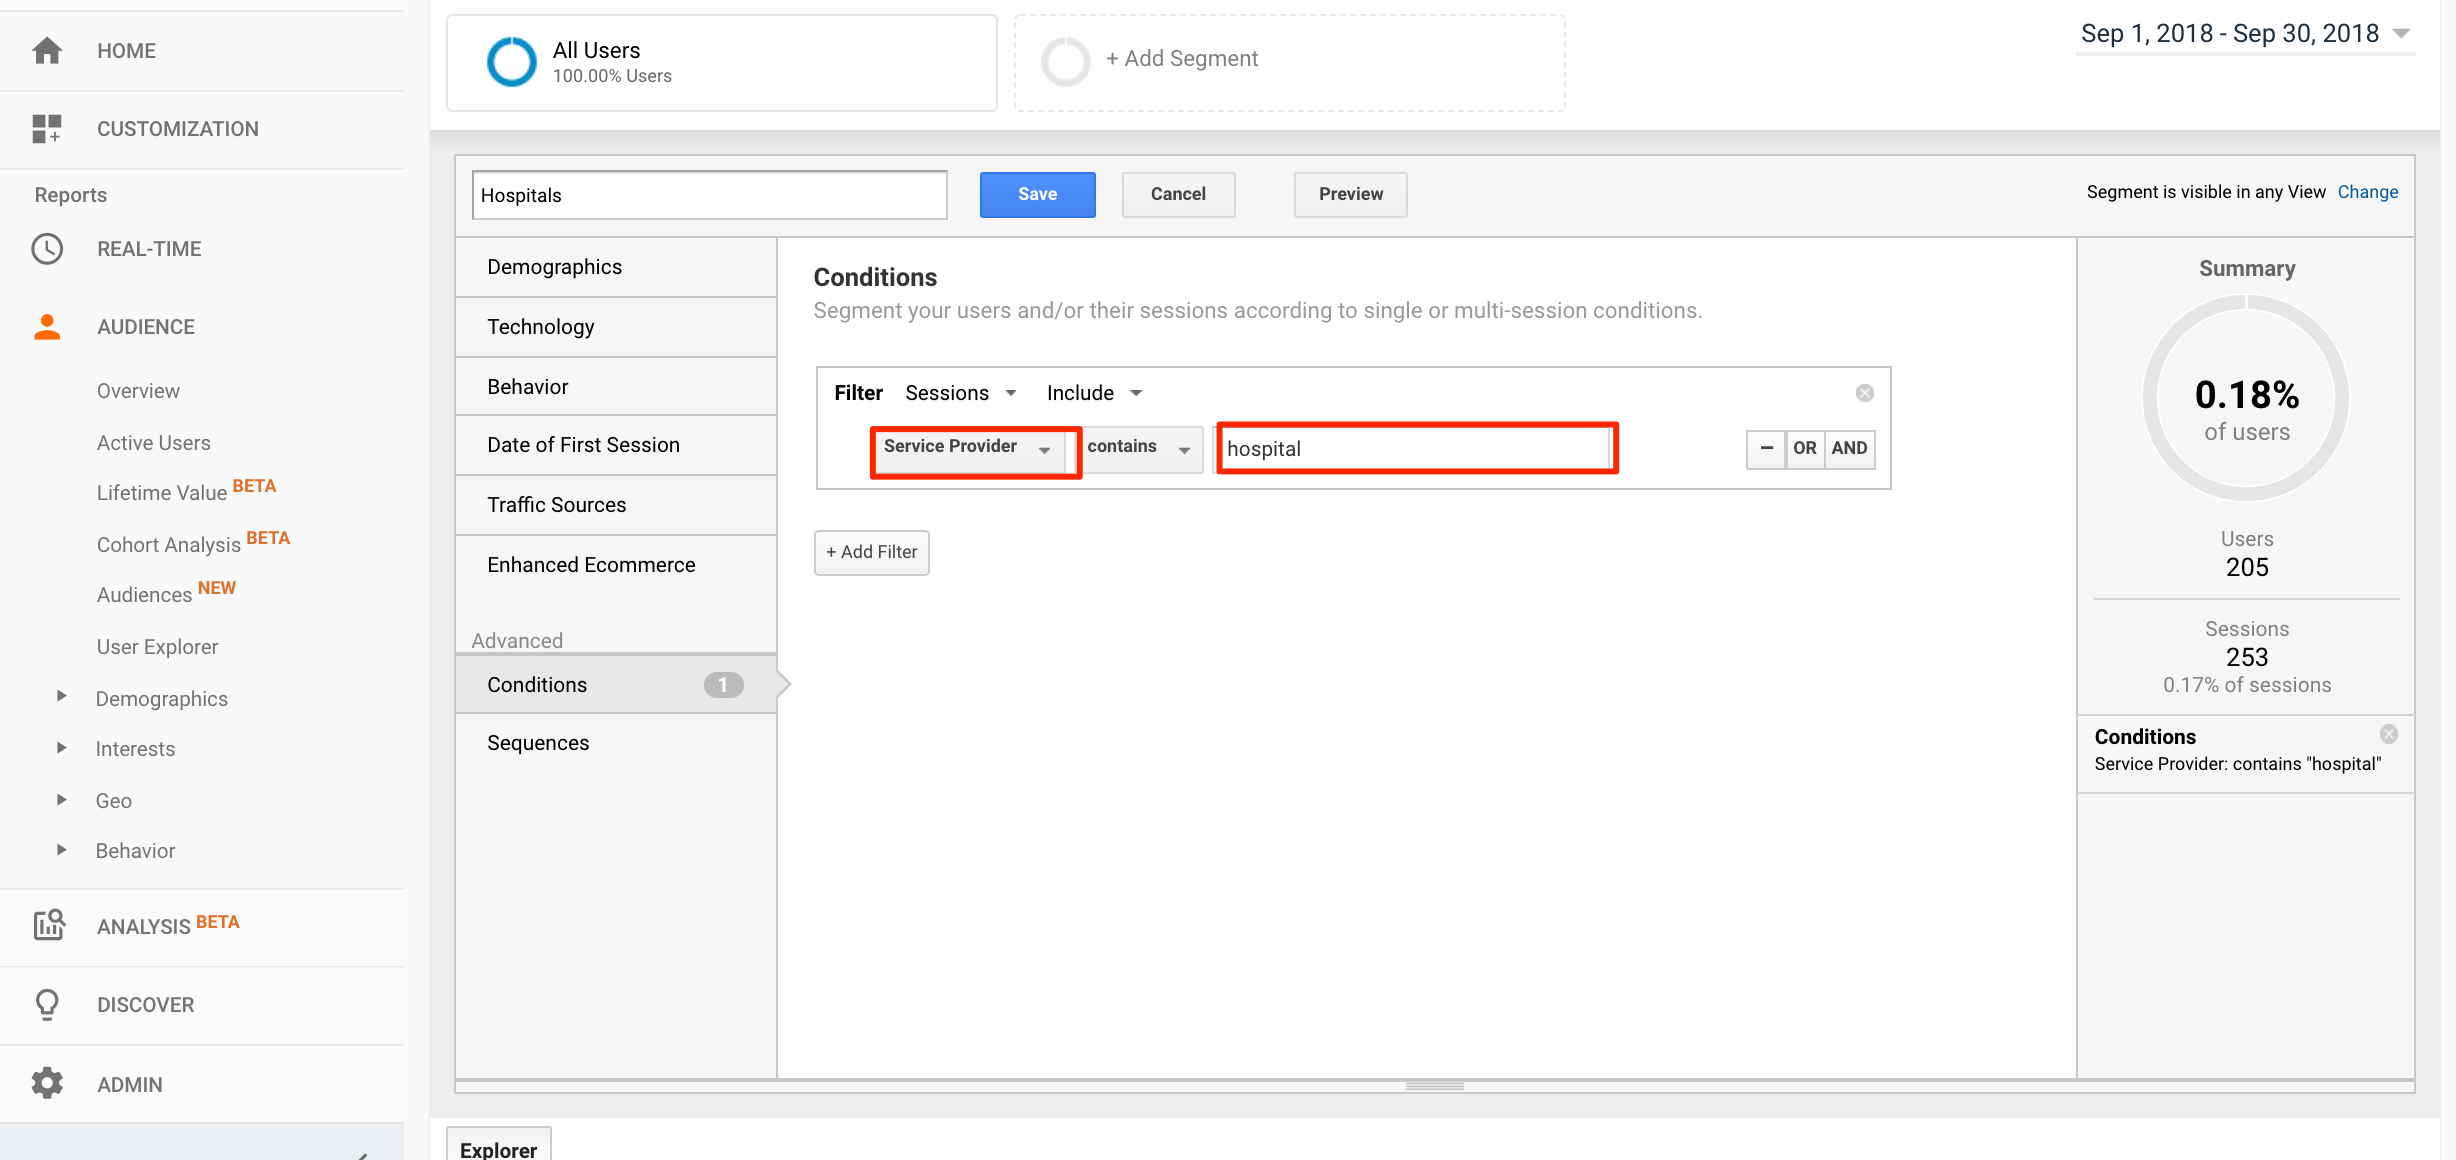
Step 1: Identify target users in Google Analytics. My client was surprised to learn that you can track in Google Analytics types of visitors, such as those coming from hospitals and schools. Under Audience > Technology > Network > Service Provider, look for the type of business you want to check. The example below lists hospitals.
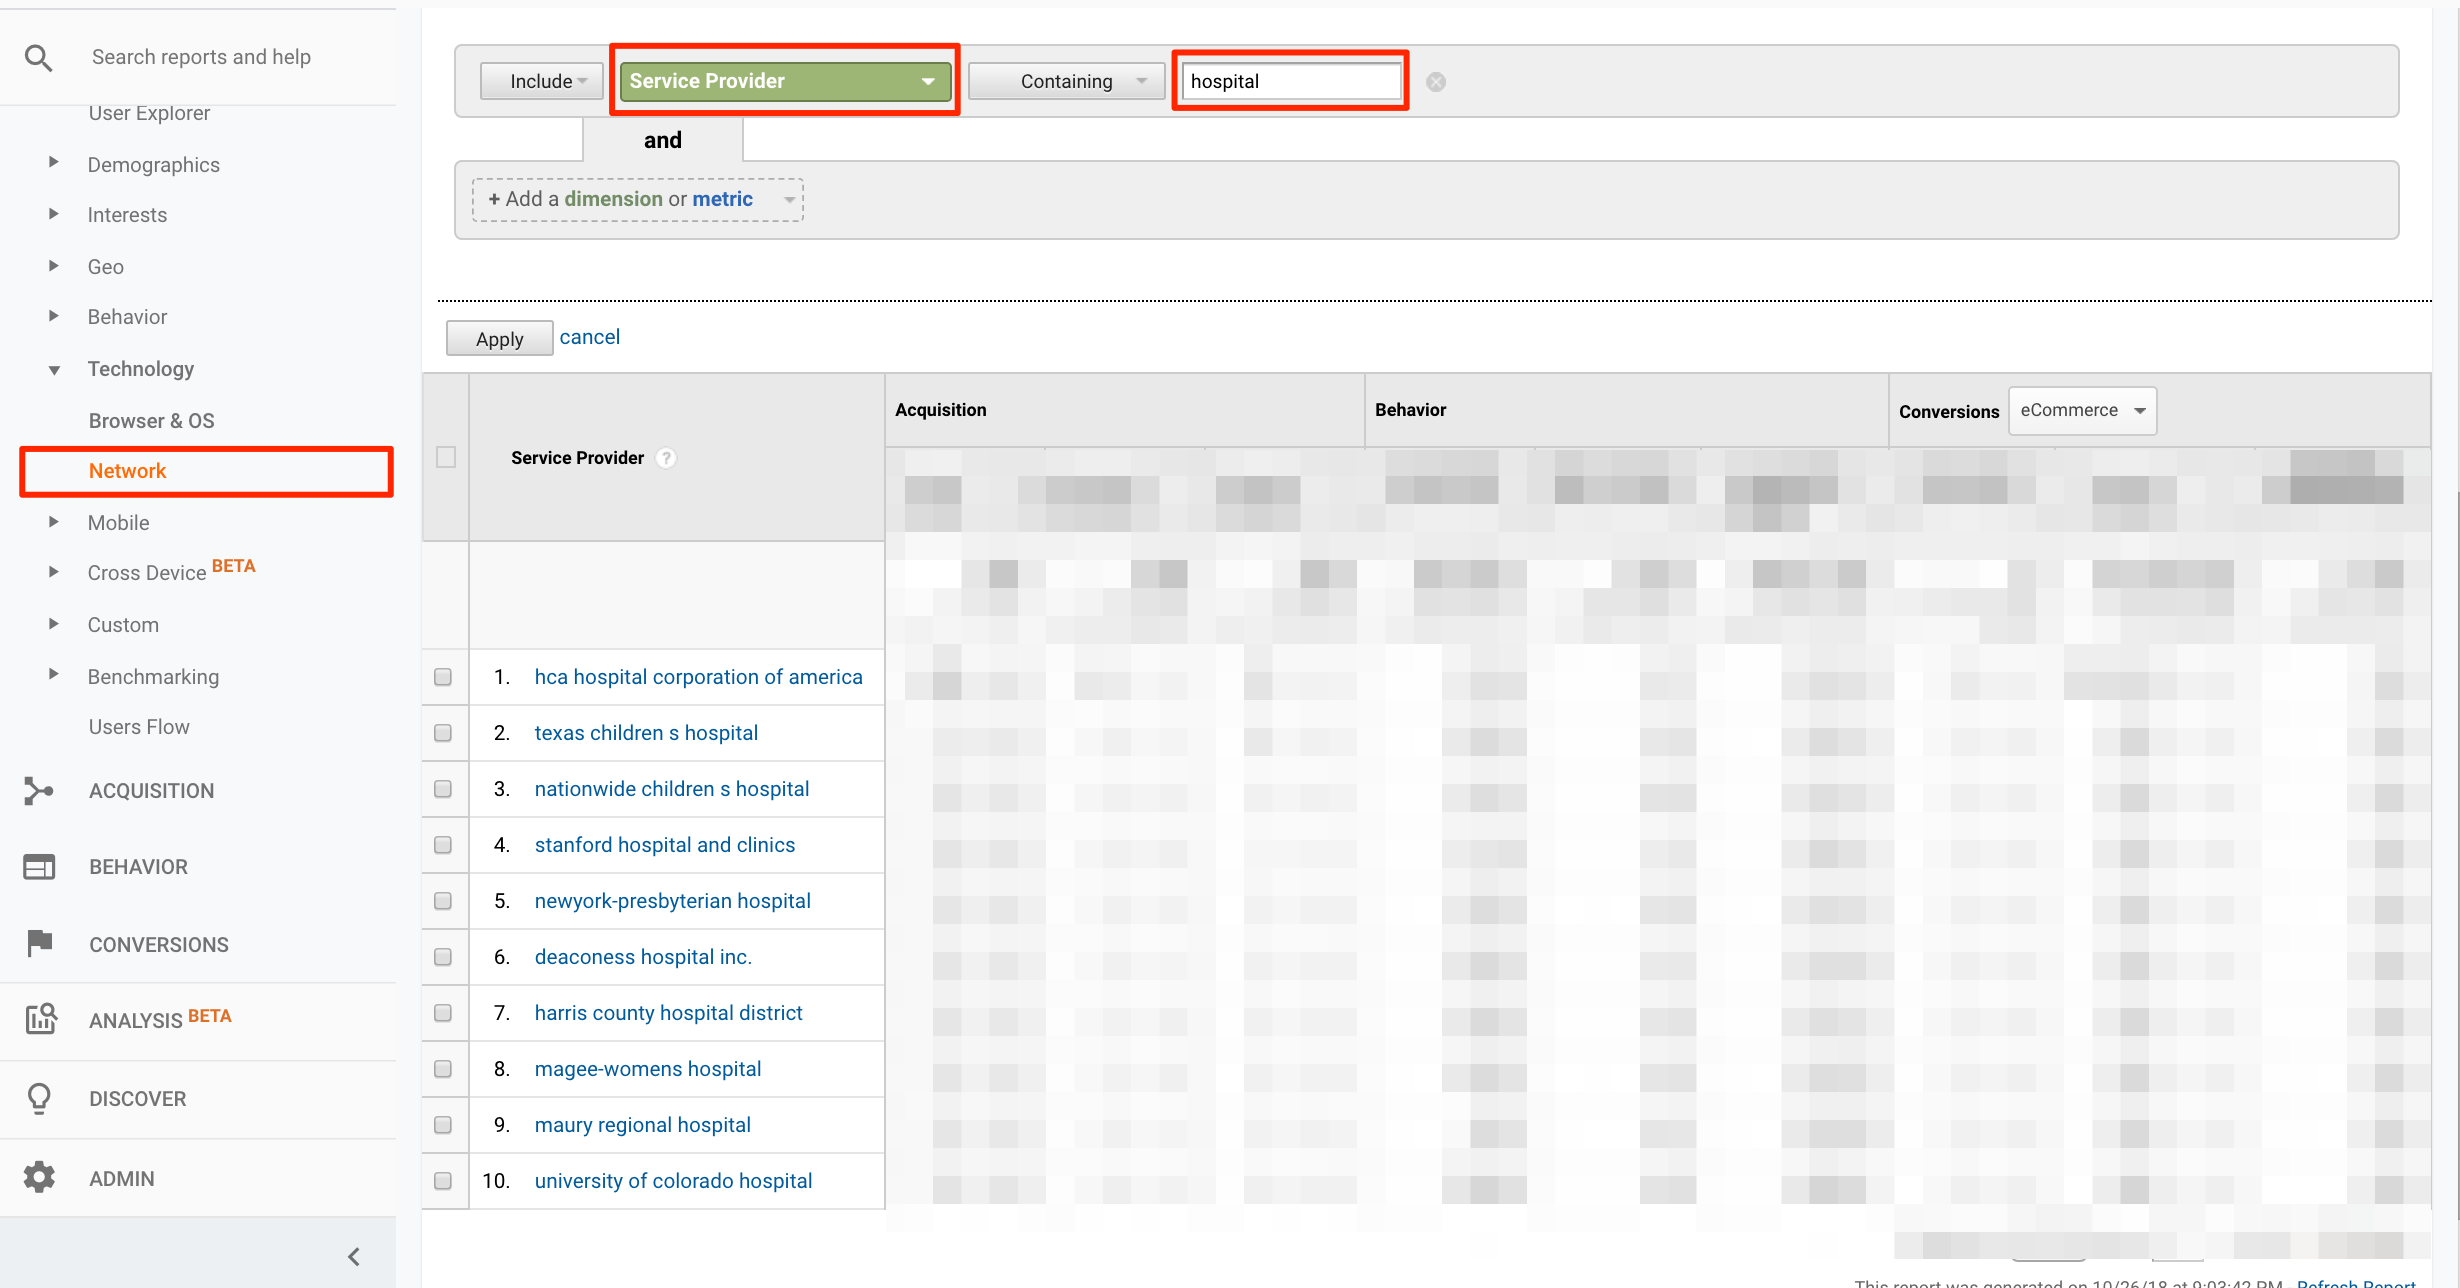
This example lists hospitals at Audience > Technology > Network > Service Provider. Click image to enlarge.
—
The example below lists schools.
The process I’m using identifies companies by their IP address. When businesses deploy dedicated internet connections, the IP address generally discloses the company. You can use services such as ip2location.com to identify the owner of any IP.
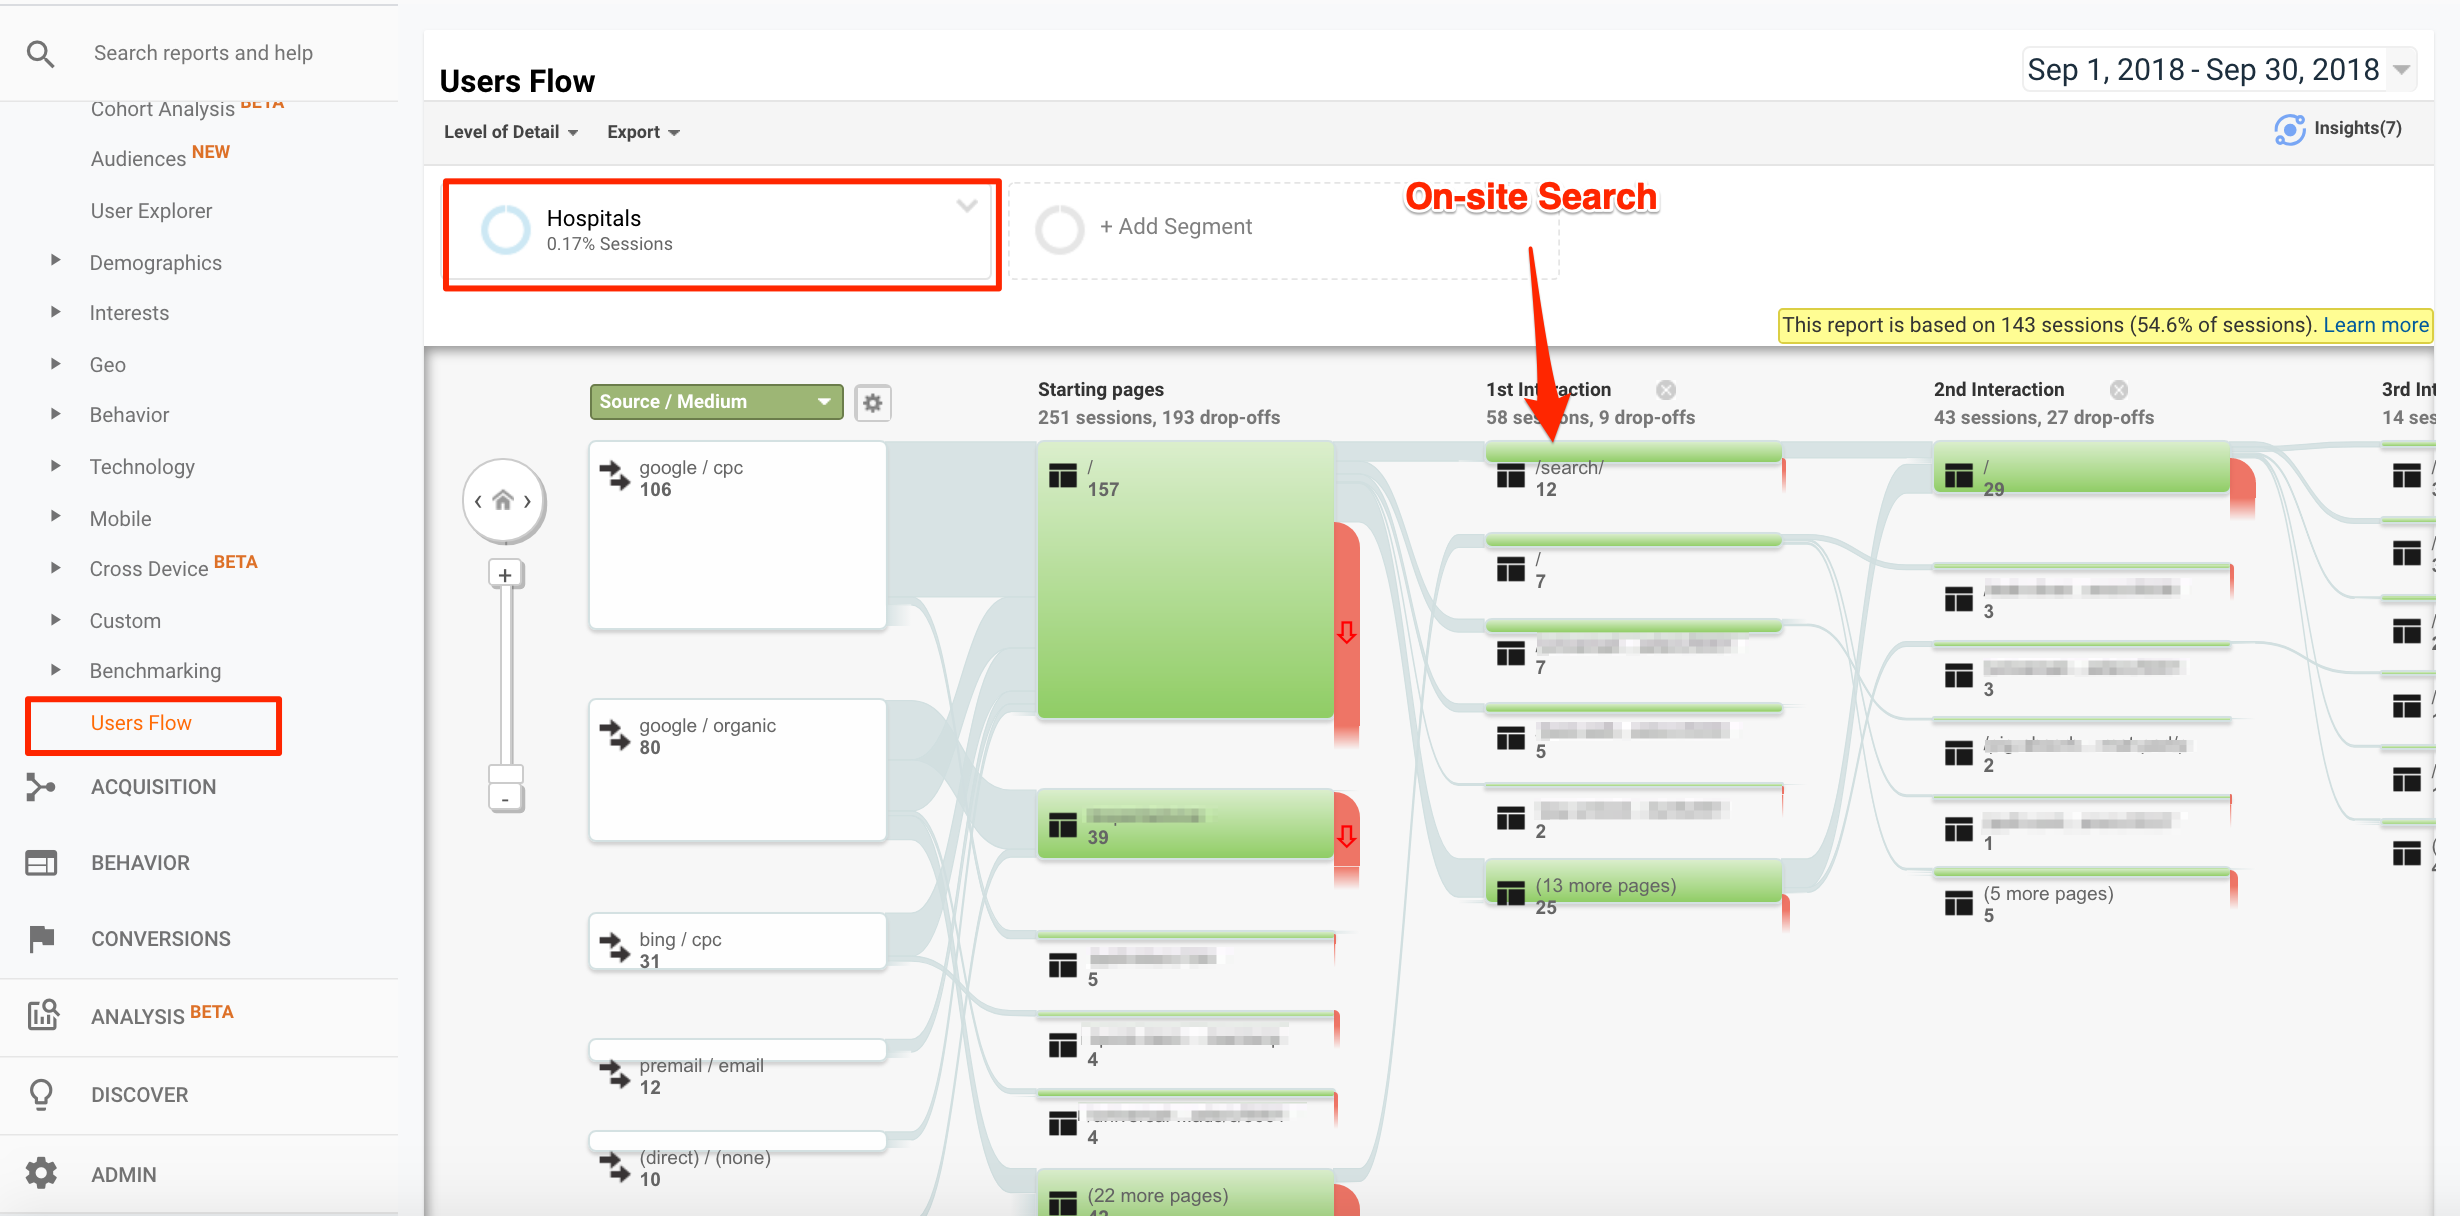
You can use the same criteria to create a segment for a specific type of visitors and businesses to track. After you create the segment, Google Analytics reports will display those visitors. The Users Flow report is especially valuable for this purpose. We can see where the visitors come from, what path they take to complete an order, and where they drop off. We can use this info to evaluate our site’s user experience.
Step 2: Review on-site searches. In the example above, we can see that after hospital visitors come from Google, their first interaction is with the site search. This indicates that they are not immediately finding what they want.
They are searching twice: once in Google, and then again on the website. But, when we checked Behavior > Site Search > Usage, we learned that there are no sales for “Visits with Site Search” from hospitals.
We have two options: Improve site search, or improve the user experience so that visitors avoid searching altogether.
Let’s explore the second option, improve the user experience. When we view the words and phrases that hospital visitors typed in the site search at Behavior > Site Search > Search Terms, we can see the products that interest them and were not otherwise obvious or easy to find.
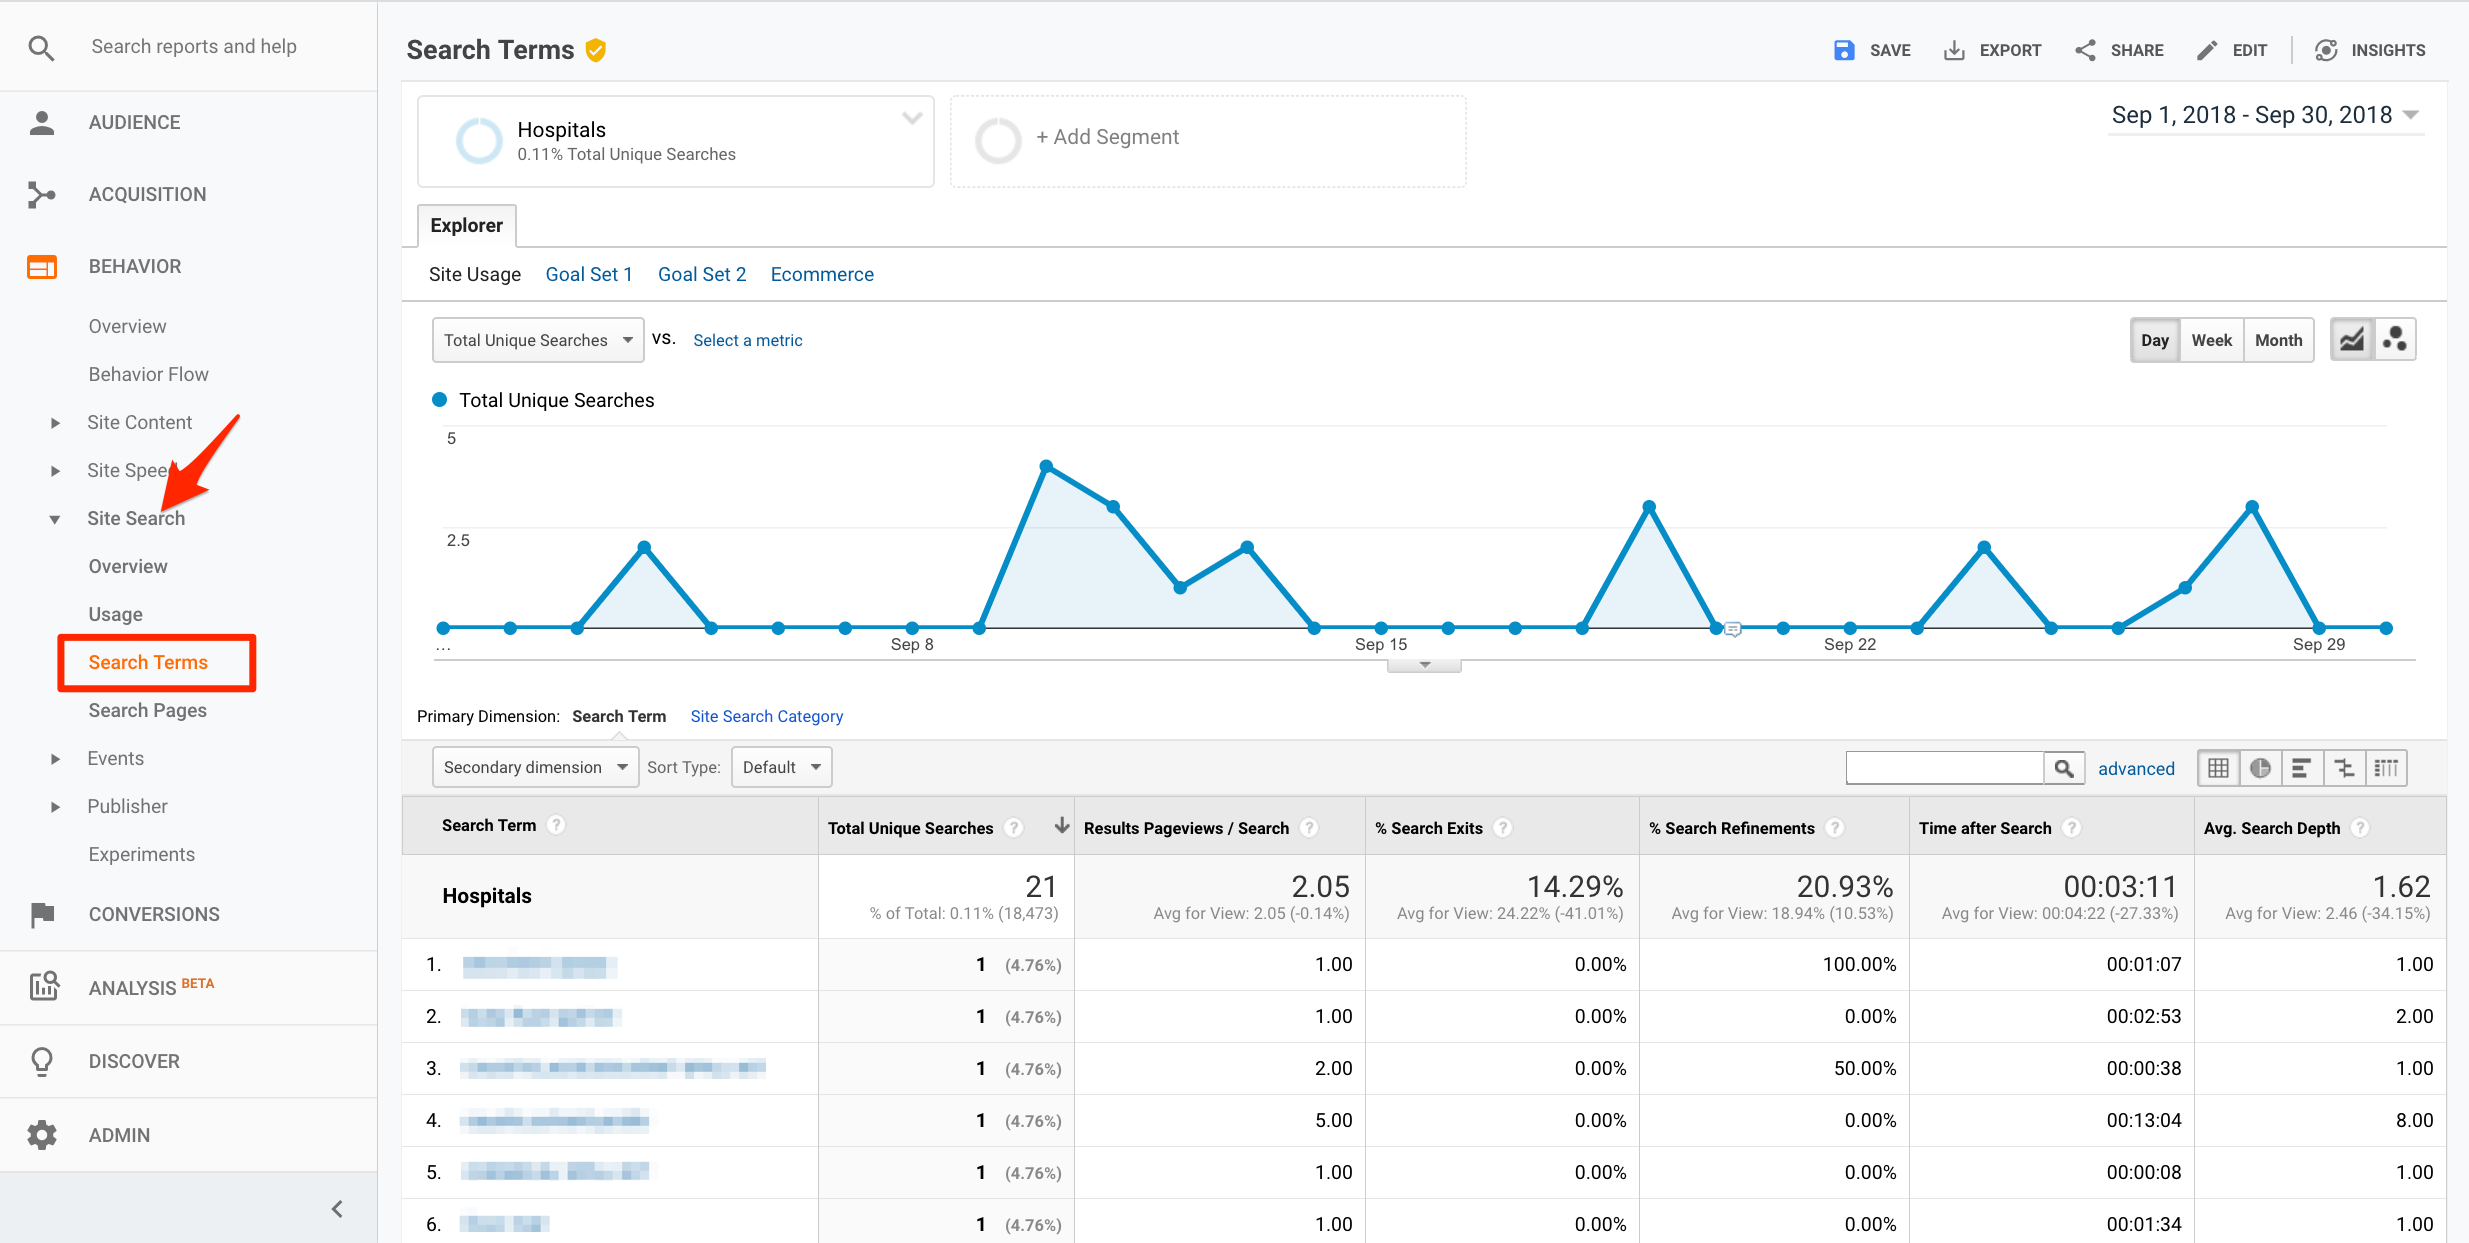
At Behavior > Site Search > Search Terms, we can discern products that visitors cannot easily find. Click image to enlarge.
We could turn these searches into prominent links in the site navigation. However, in my client’s case, the search terms did not apply to enough visitors to warrant that kind of visibility.
We chose instead to add a filter to the faceted navigation of the site to organize products by industry type: hospitals, schools, commercial facilities. When the user selects the hospital filter, for example, we promote products related to the most popular search terms we found in the site search reports.
